Paying close attention to the larger fraction of the poor entrepreneurs
Monthly Revenue of a ‘Chai-wala’
It is very common discussion among group of youngsters to roughly estimate revenue of their “Snacks n’ Tea” seller while enjoying that short break. The discussion ends when the earnings estimate from that seller’s business reaches to a figure which is far bigger than what these “highly qualified” youngsters actually earn thereby inspiring them to think about pursuing their own business, start-up. What actually happens after such short surge of inspiration is also a common knowledge. Very few of such people actually work on entrepreneurship, their business idea and again very few of these truly taste the success. Social media, mainstream media have also positively affected and boosted the startup mentality, entrepreneur mentality among the youngsters through TV-series, reality shows, success stories, popular talk shows, podcasts and nonetheless video platforms like YouTube. The “F.I.R.E. culture” (Financially independent, Retire early) is also one wave of thought which inspires such entrepreneurs to create something of value, turn it into a business and sell it at higher valuation to gain financial independence early in life. (Although, FIRE is not limited to financial freedom through entrepreneurship only). Following their passion and working over it to create a start-up and then becoming a wealthy person is also one famous new career route for today’s youngsters.
In short, for our generation, entrepreneurship holds the key to financial independence thereby key to the freedom (materialistic freedom to be more specific) – life living on their own terms, without any terms and conditions.
When looked through “the pop-cultural” lens towards entrepreneurship one will see all the glamour, money, popularity, angel investors, “unicorn startup” funds and success stories. In reality there are very few practical examples in these enterprises which successfully fit to all such criterion, which really have created value in the society; most of them are actually just publicized bubbles rather black holes sucking in the attention, time and money of the investors.
The Reality of Entrepreneurship Around the World
Start-ups represent only the early developmental part of an entrepreneurship. Even though they represent such an early and small part of the concept of entrepreneurship, start-up stands as the biggest lamp, biggest fire attracting the youth like moths.
Here are some interesting facts:
9 out of 10 startups fail
7.5 out of 10 venture-backed startups fail
2 out of 10 new businesses fail in the first year of operations
Only 1% of startups become unicorn firms like Uber, Airbnb, Slack, Stripe, and Docker
The success percentage for first-time founders is 18%
20% start-ups fail before the end of their 1st year, and almost 70% start-ups end by their 10th year.
These facts are not presented to demean the value of stat-ups or to negatively criticize start-ups thereby idea of entrepreneurship (although there are some people who also try to capitalize their failure in both the good and bad ways). When you will look at the complementary positive data on start-ups you will realize that the successful start-ups even being low in numbers created value to the society in totally different ways, they changed the ways of working and doing things through the exploitation of technology.
The glamour while portraying the concept of entrepreneurship is actually overshadowing the key idea behind it which is “ingenuity”.
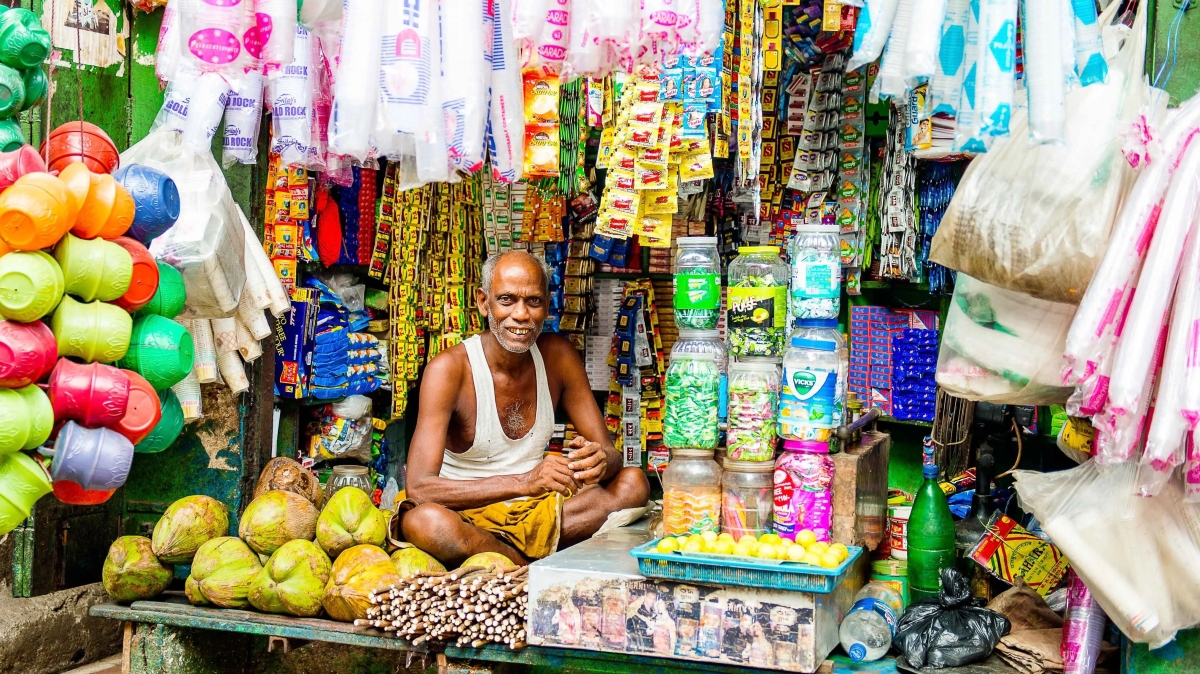
Poor Entrepreneurs
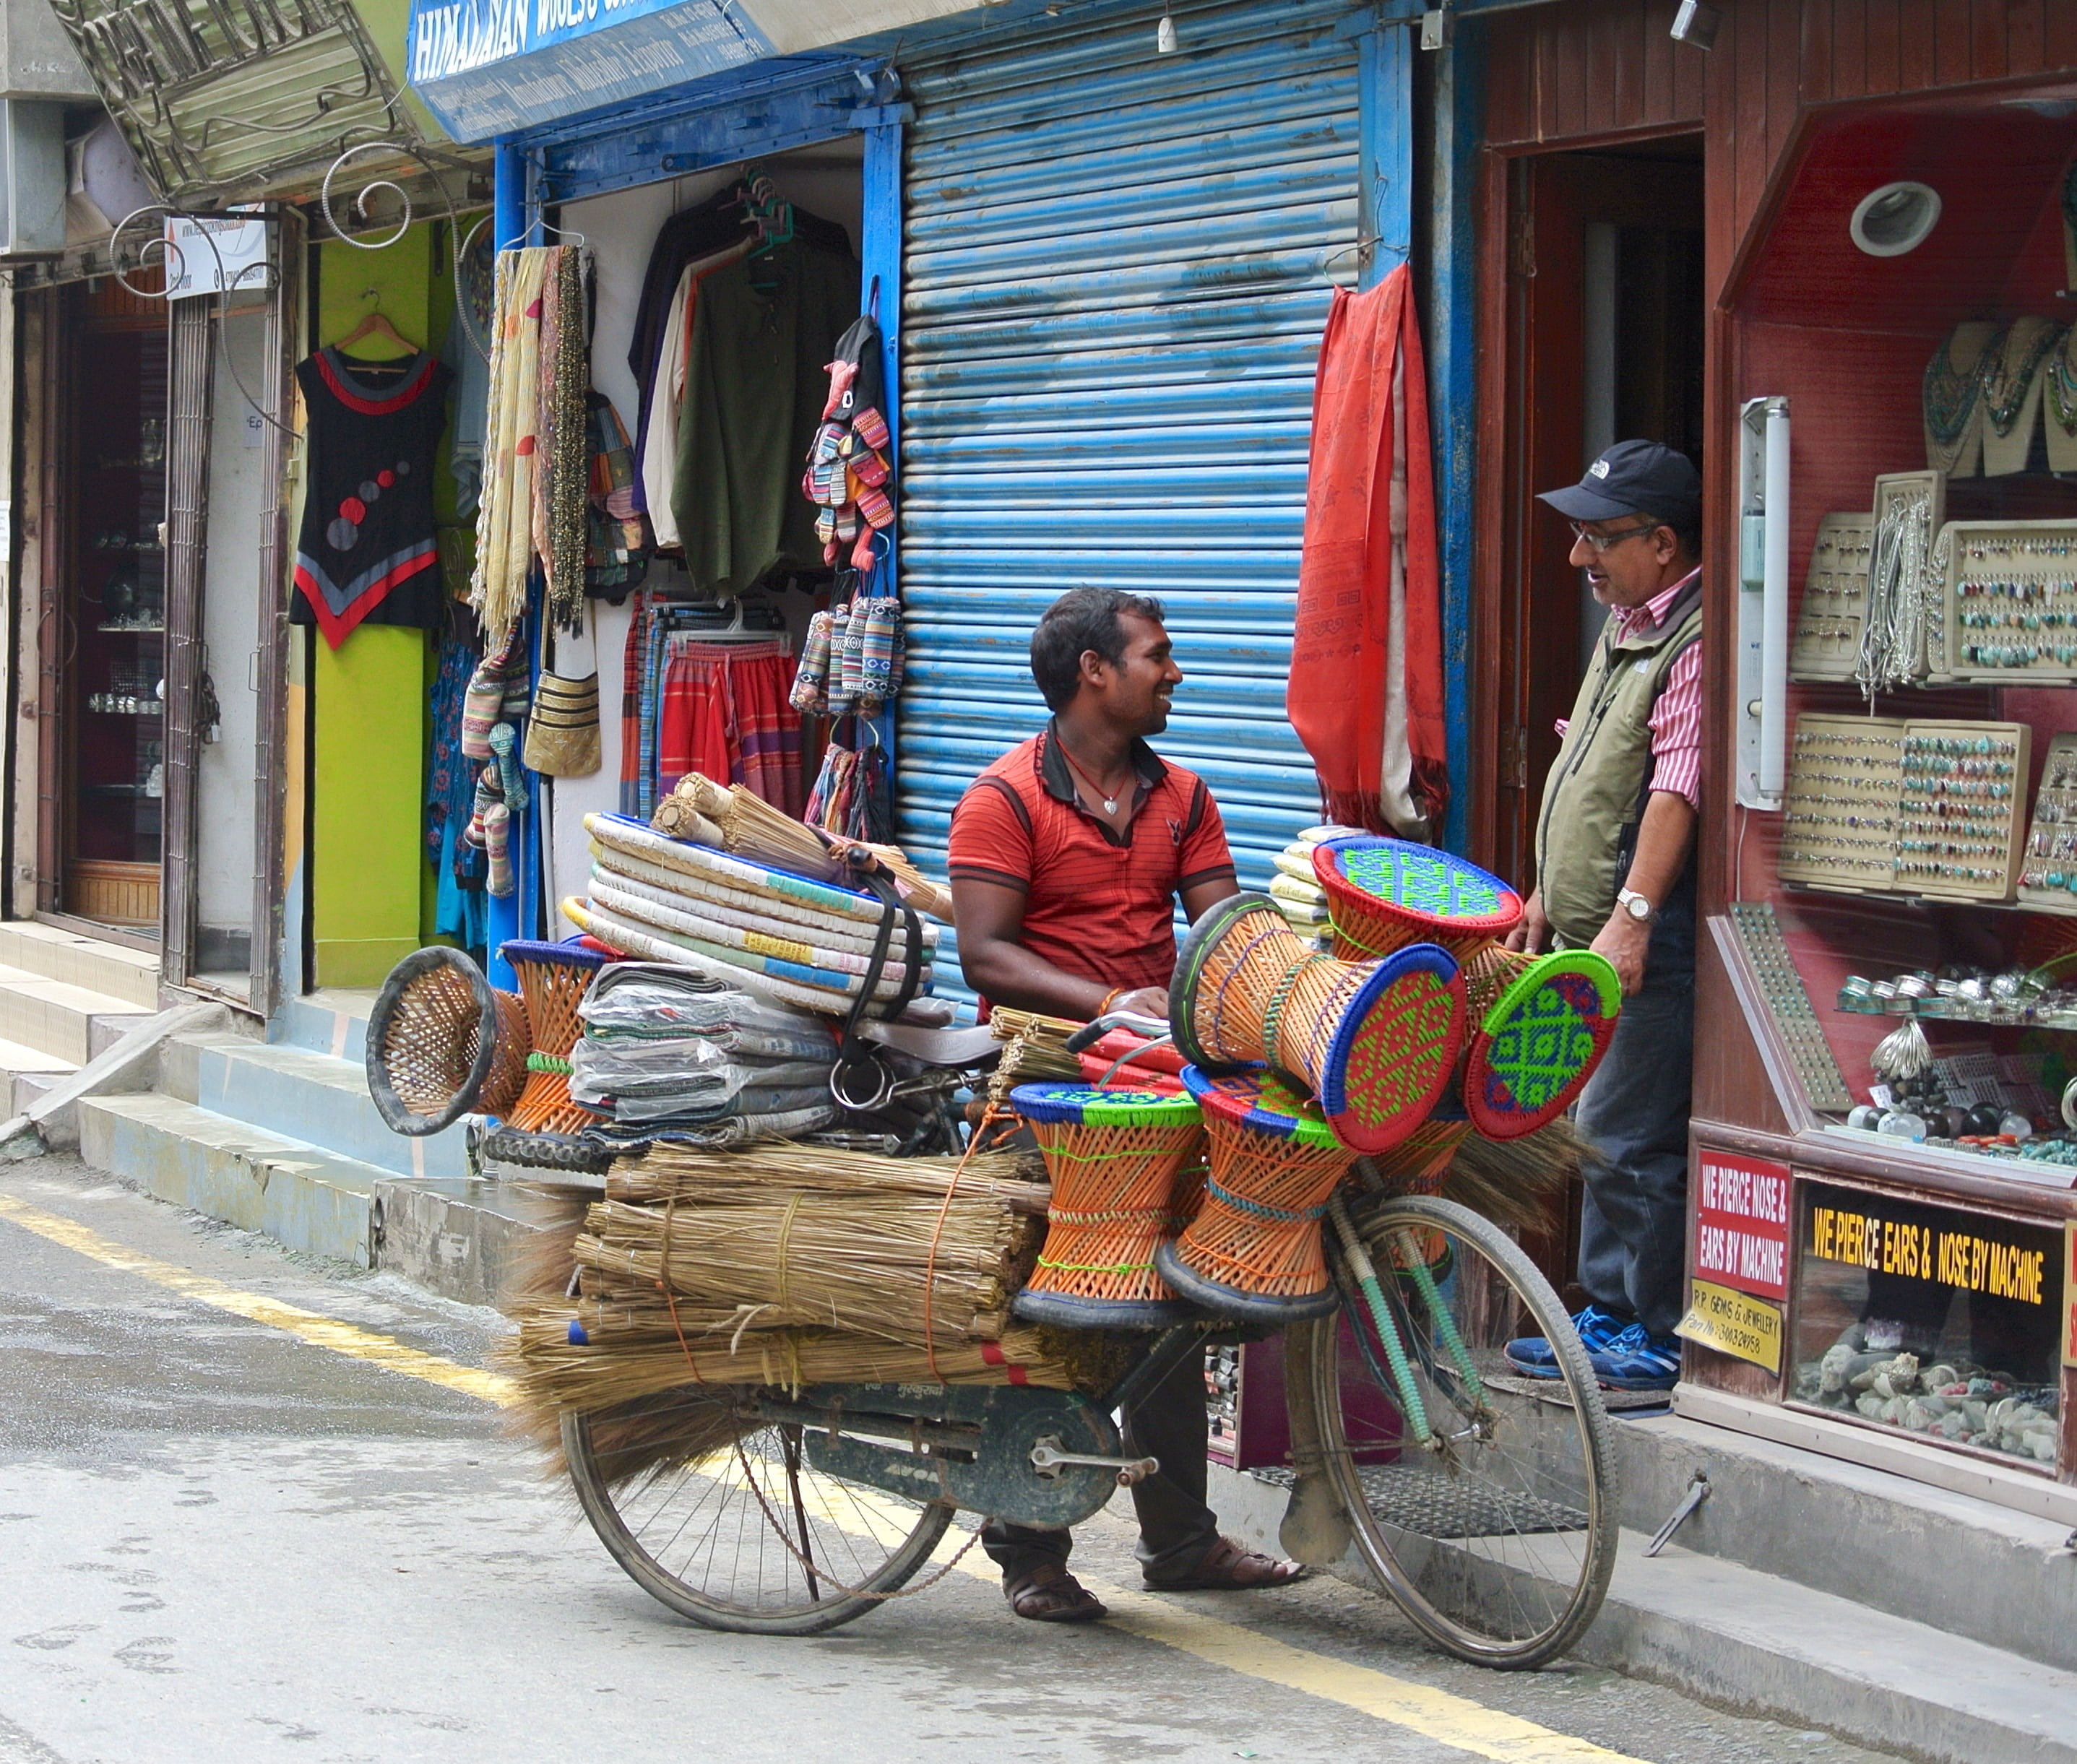

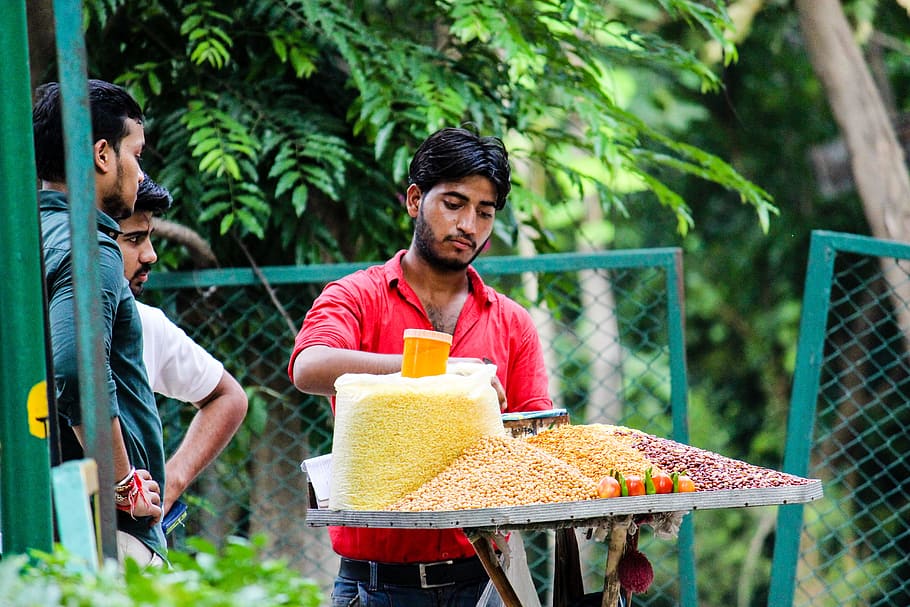
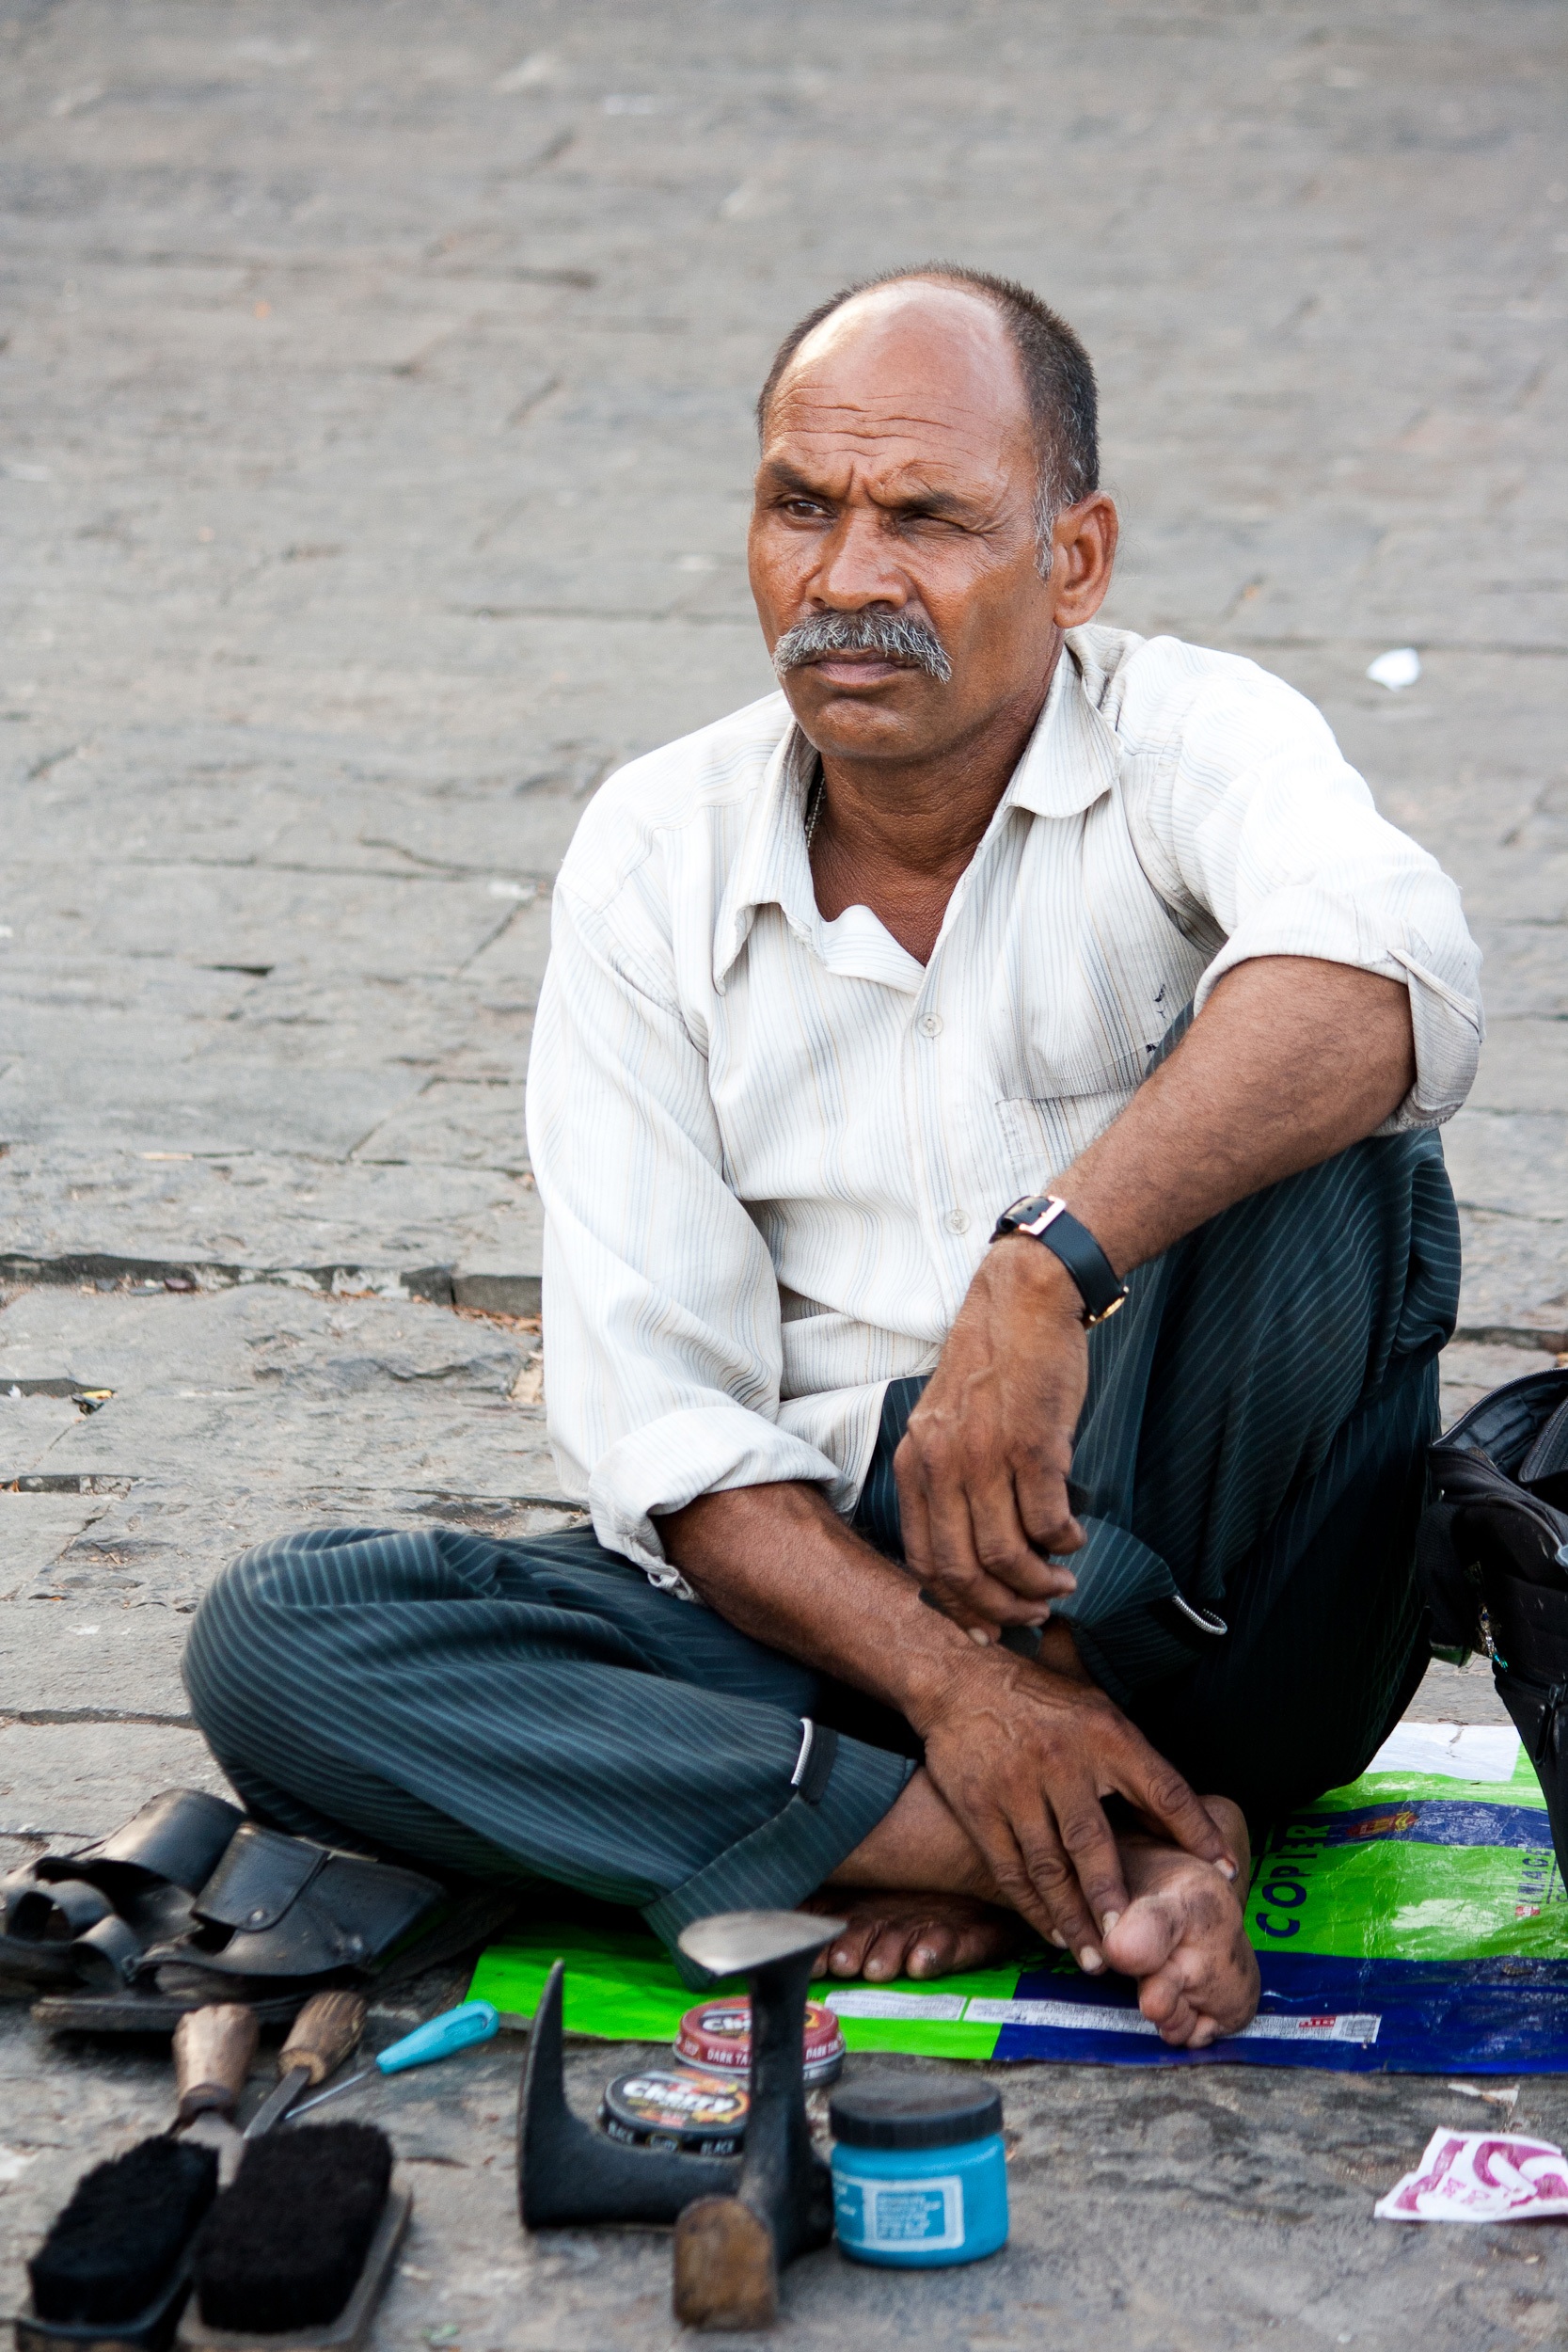
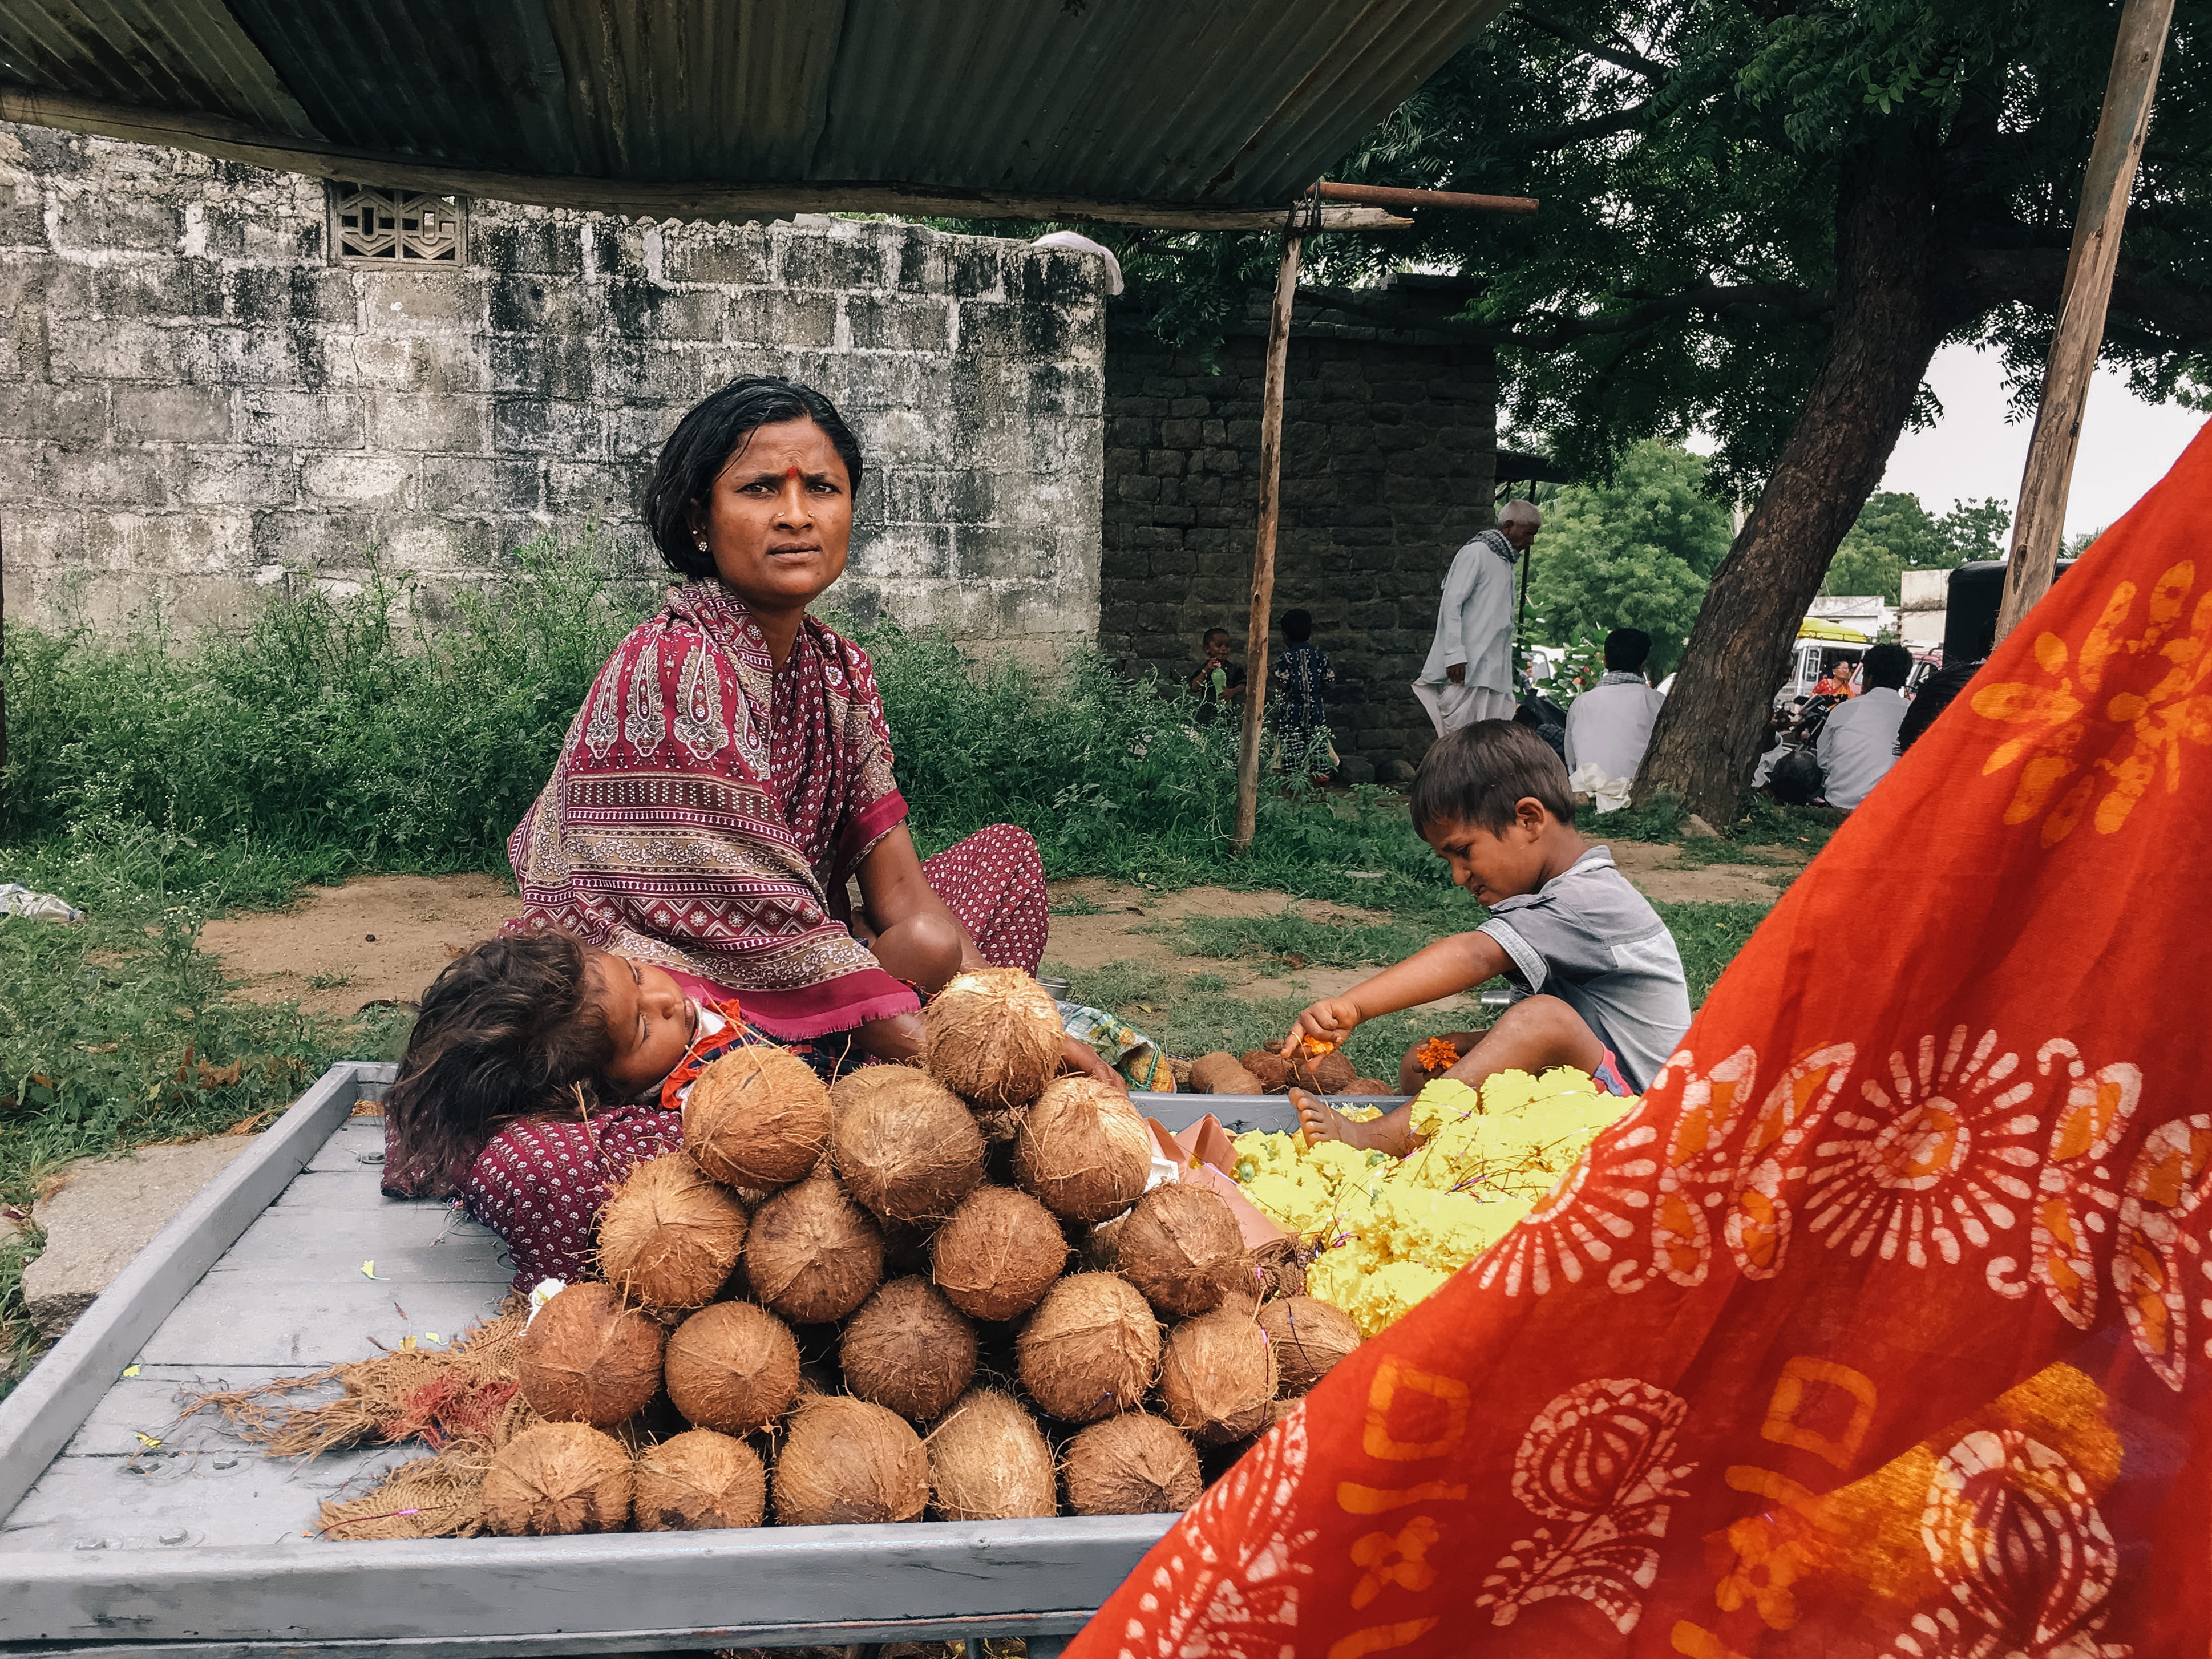
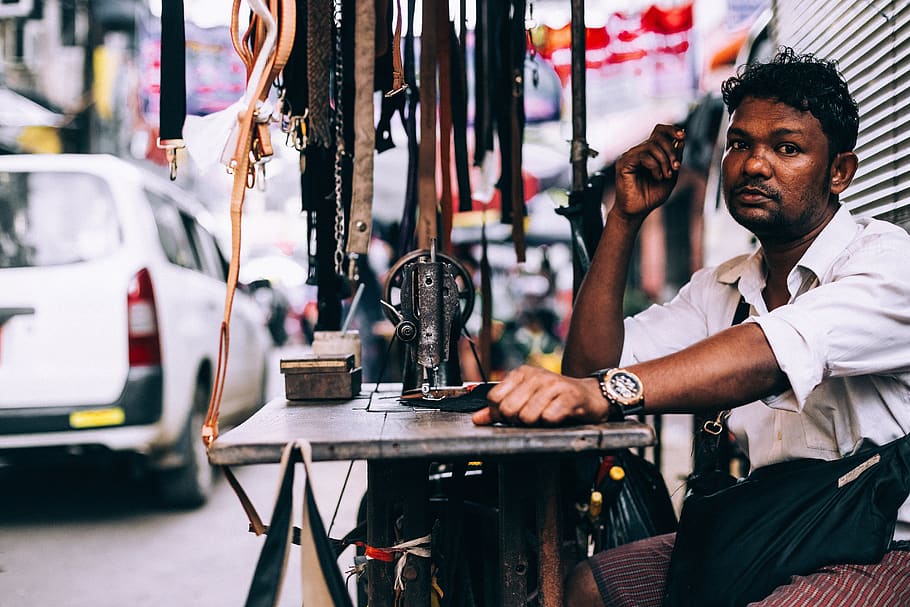
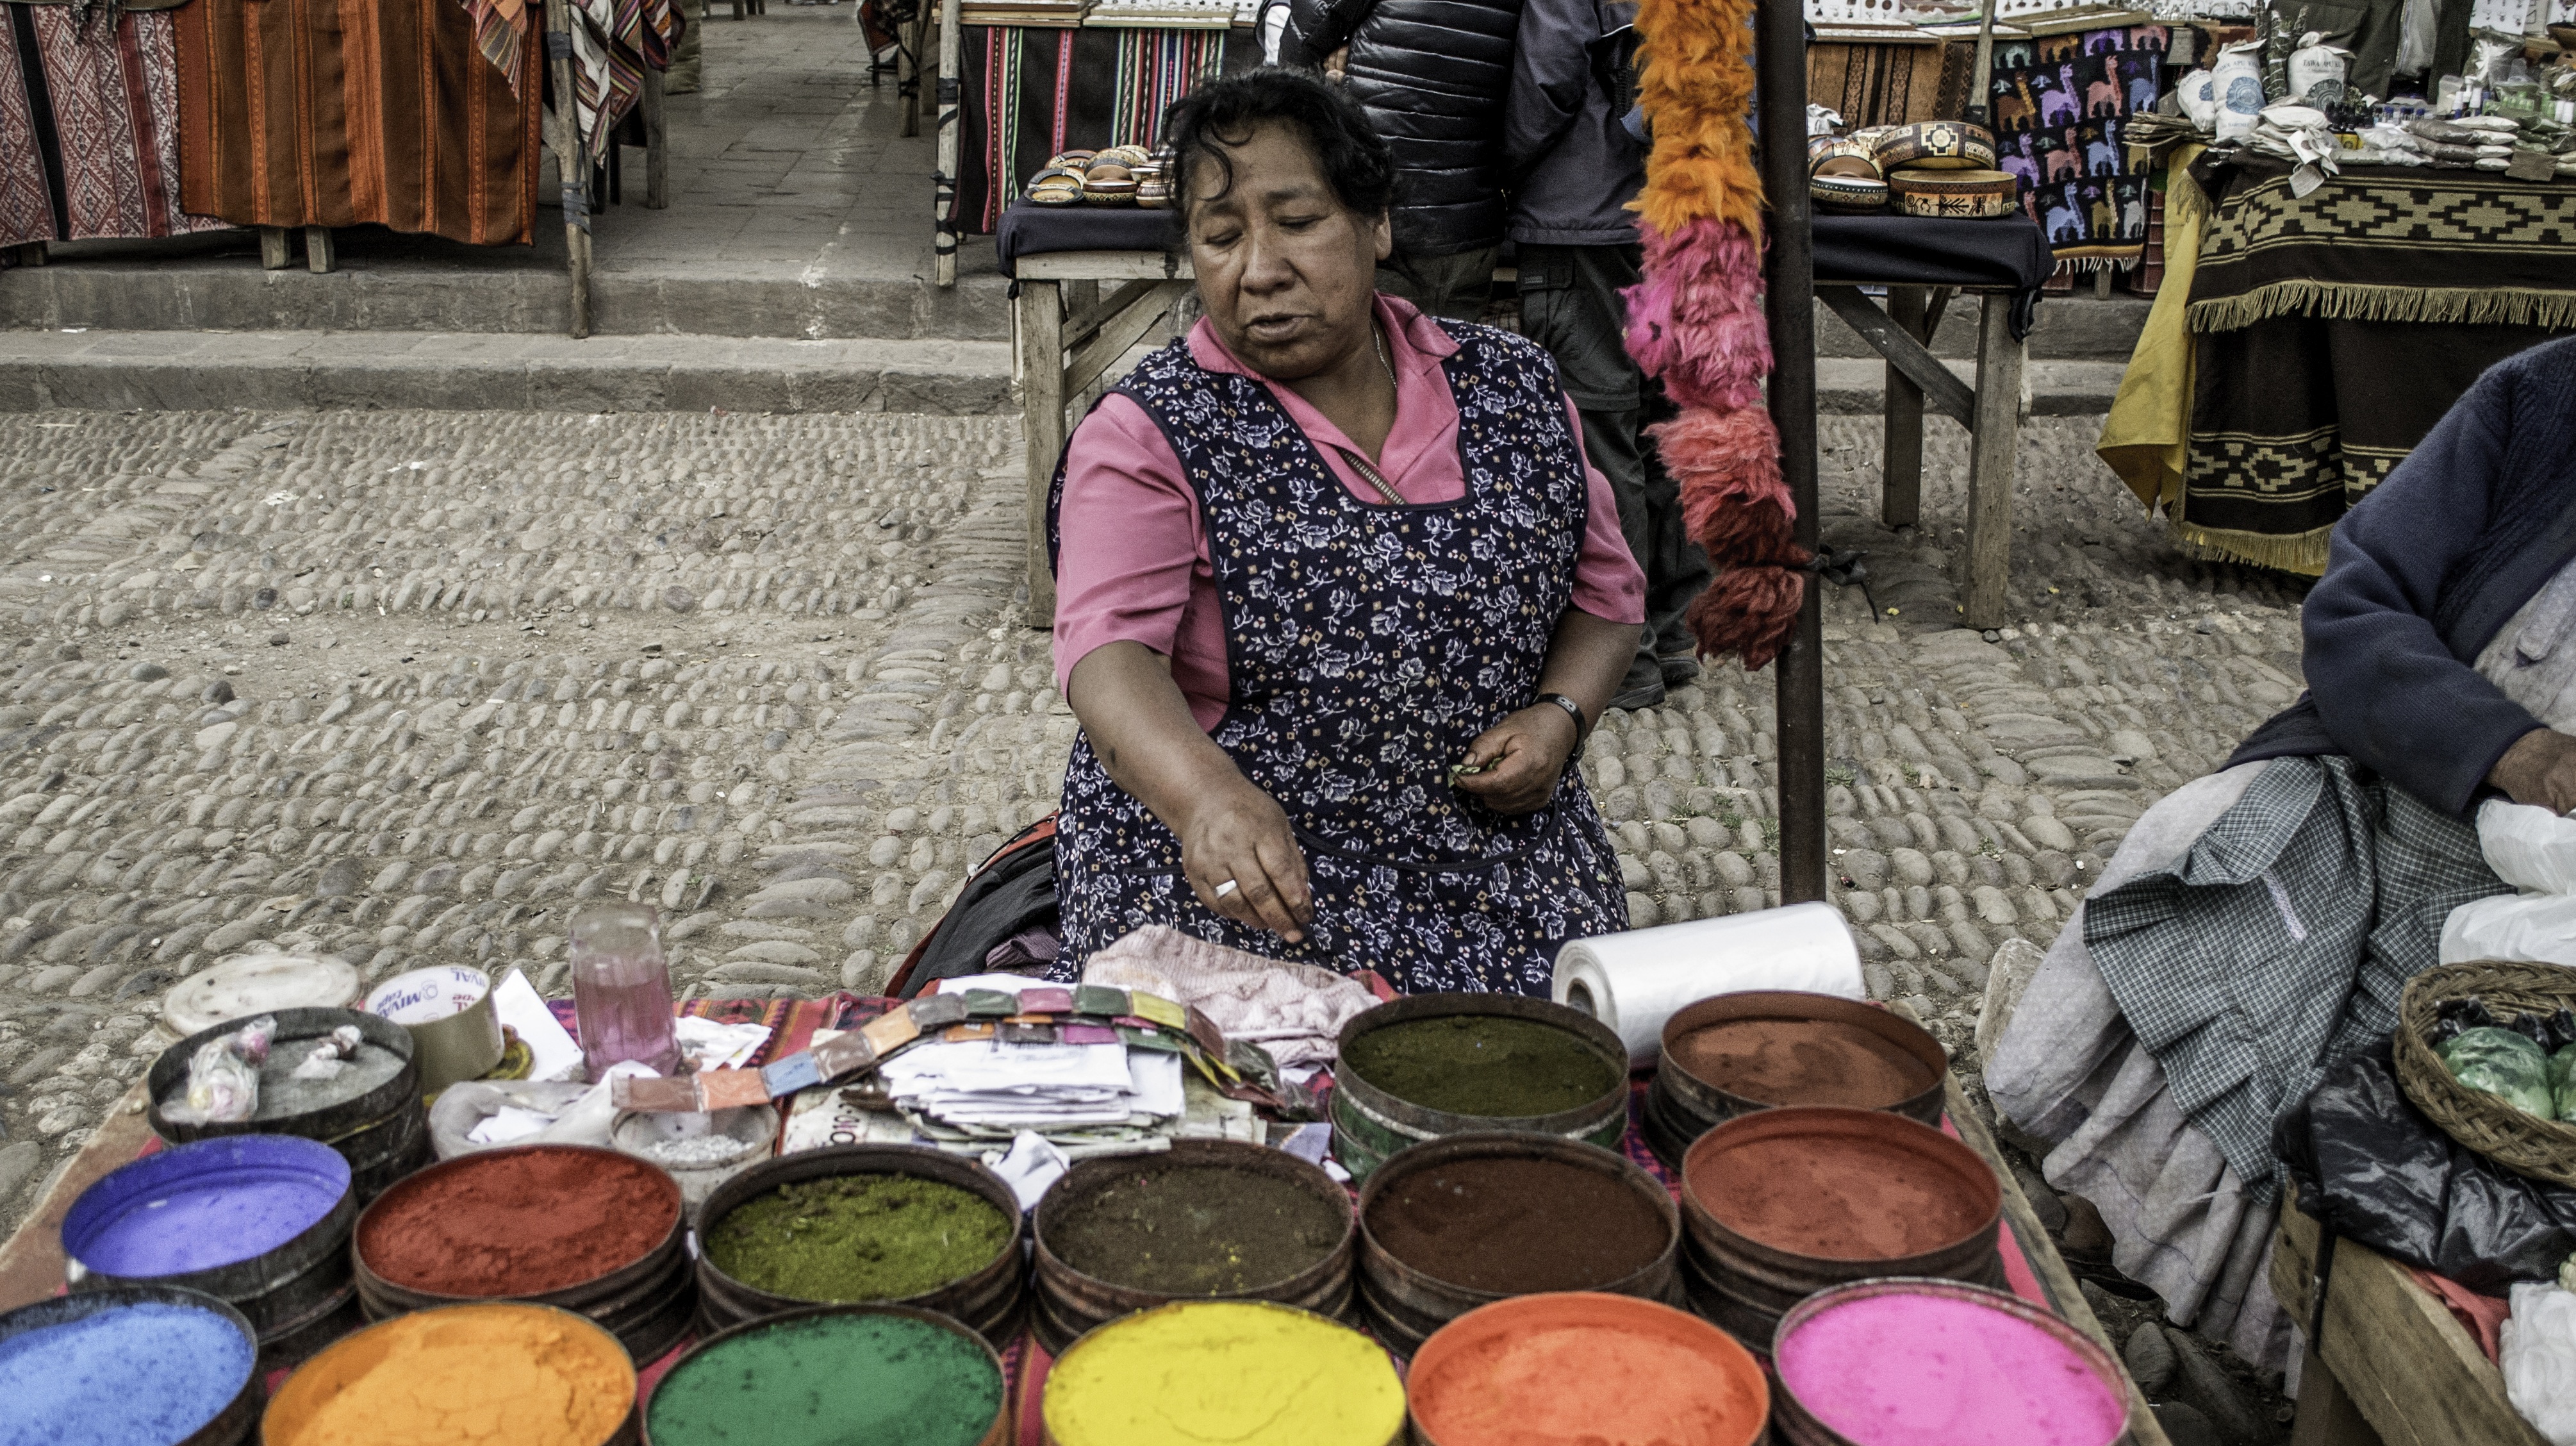
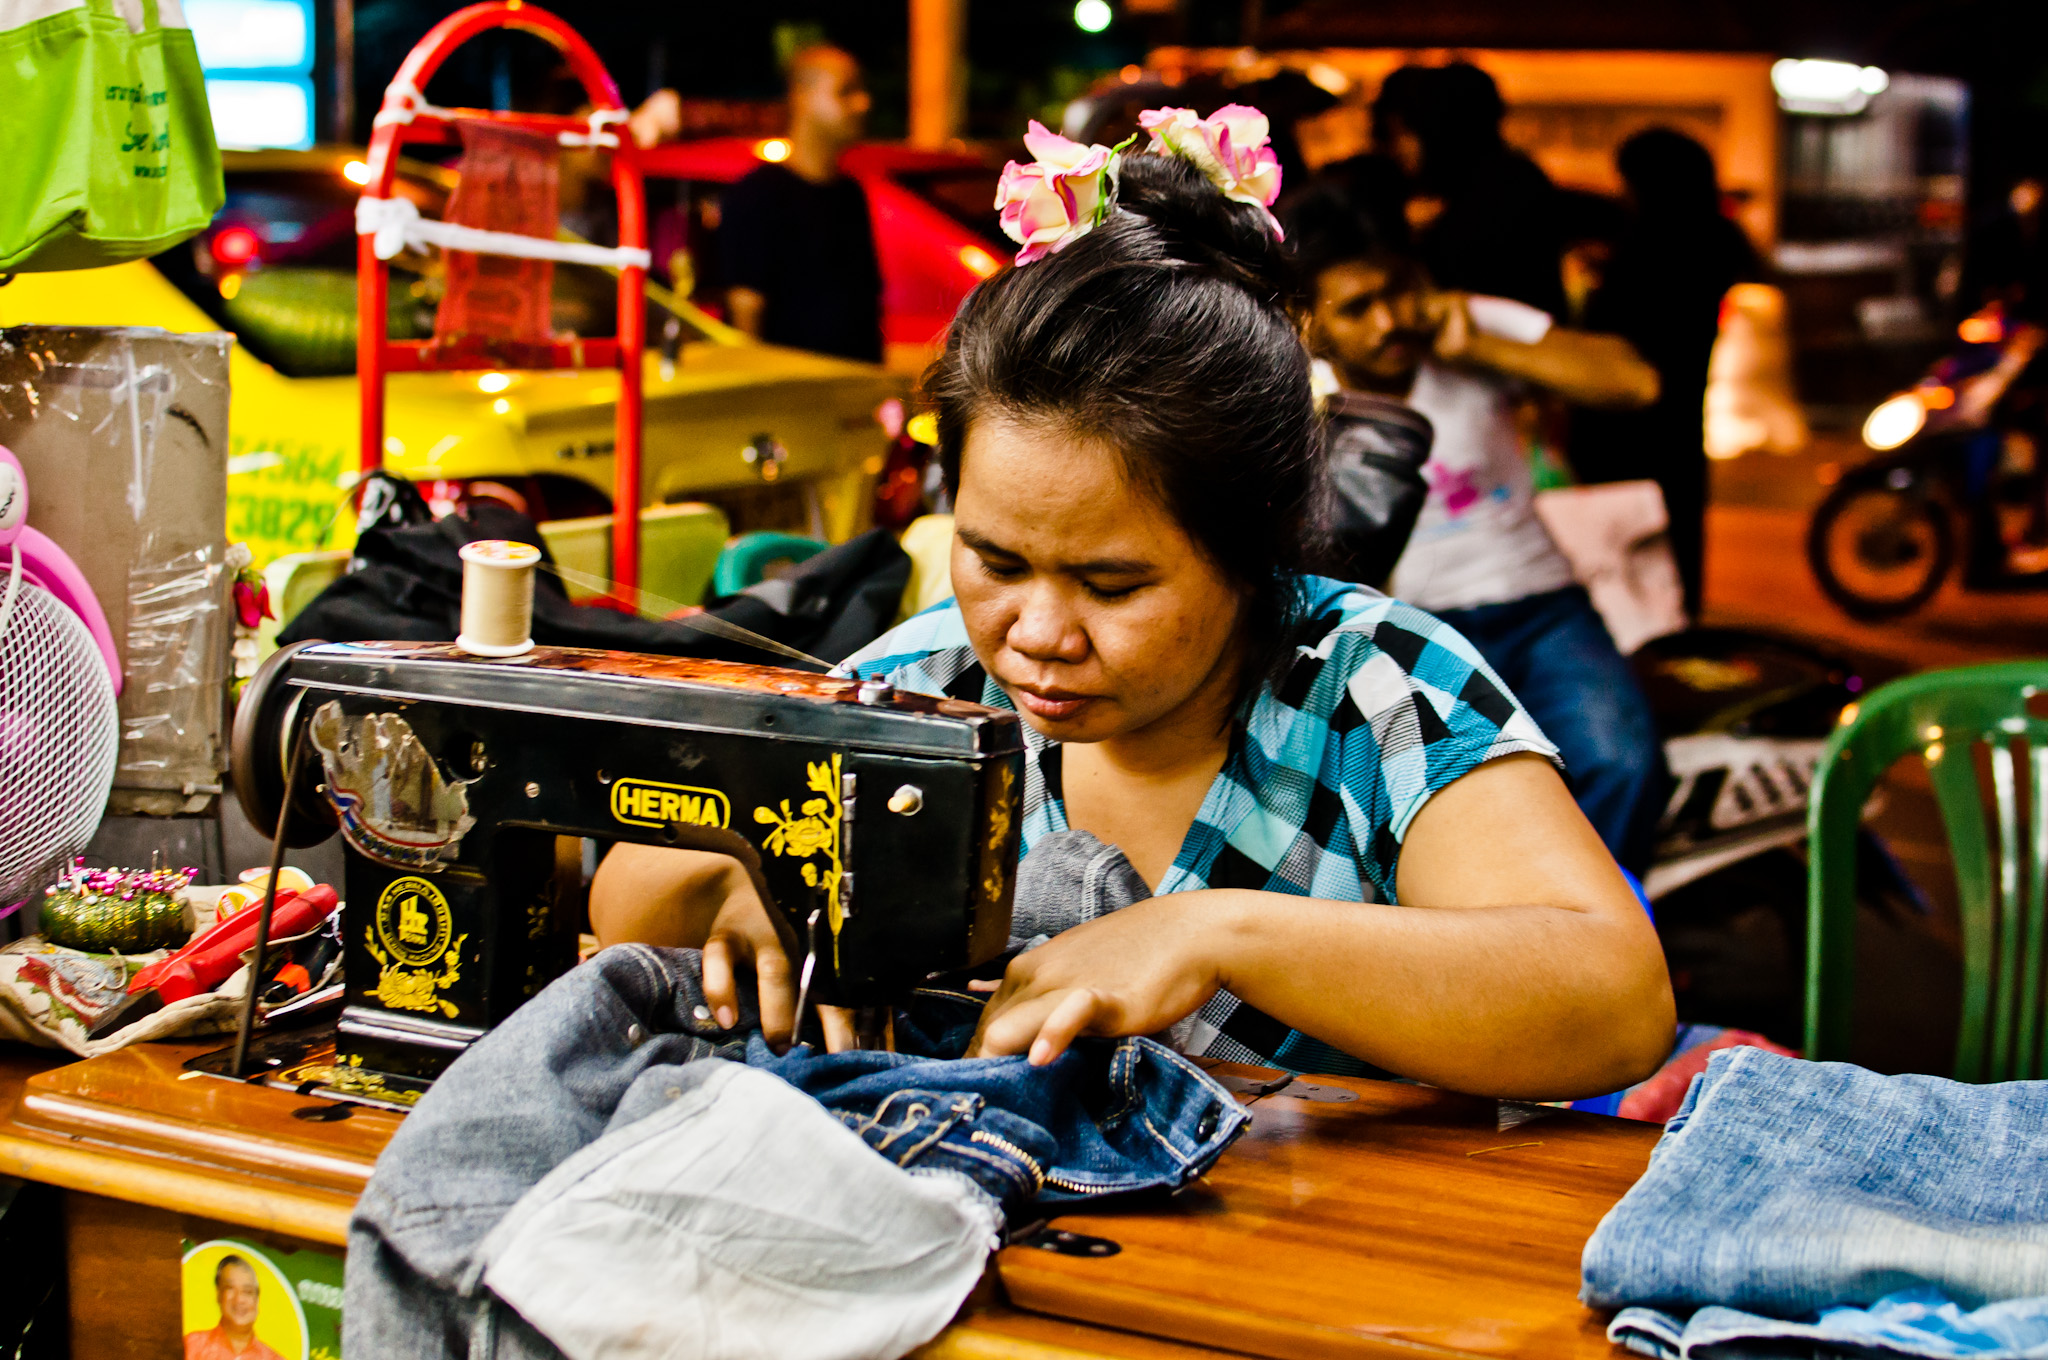
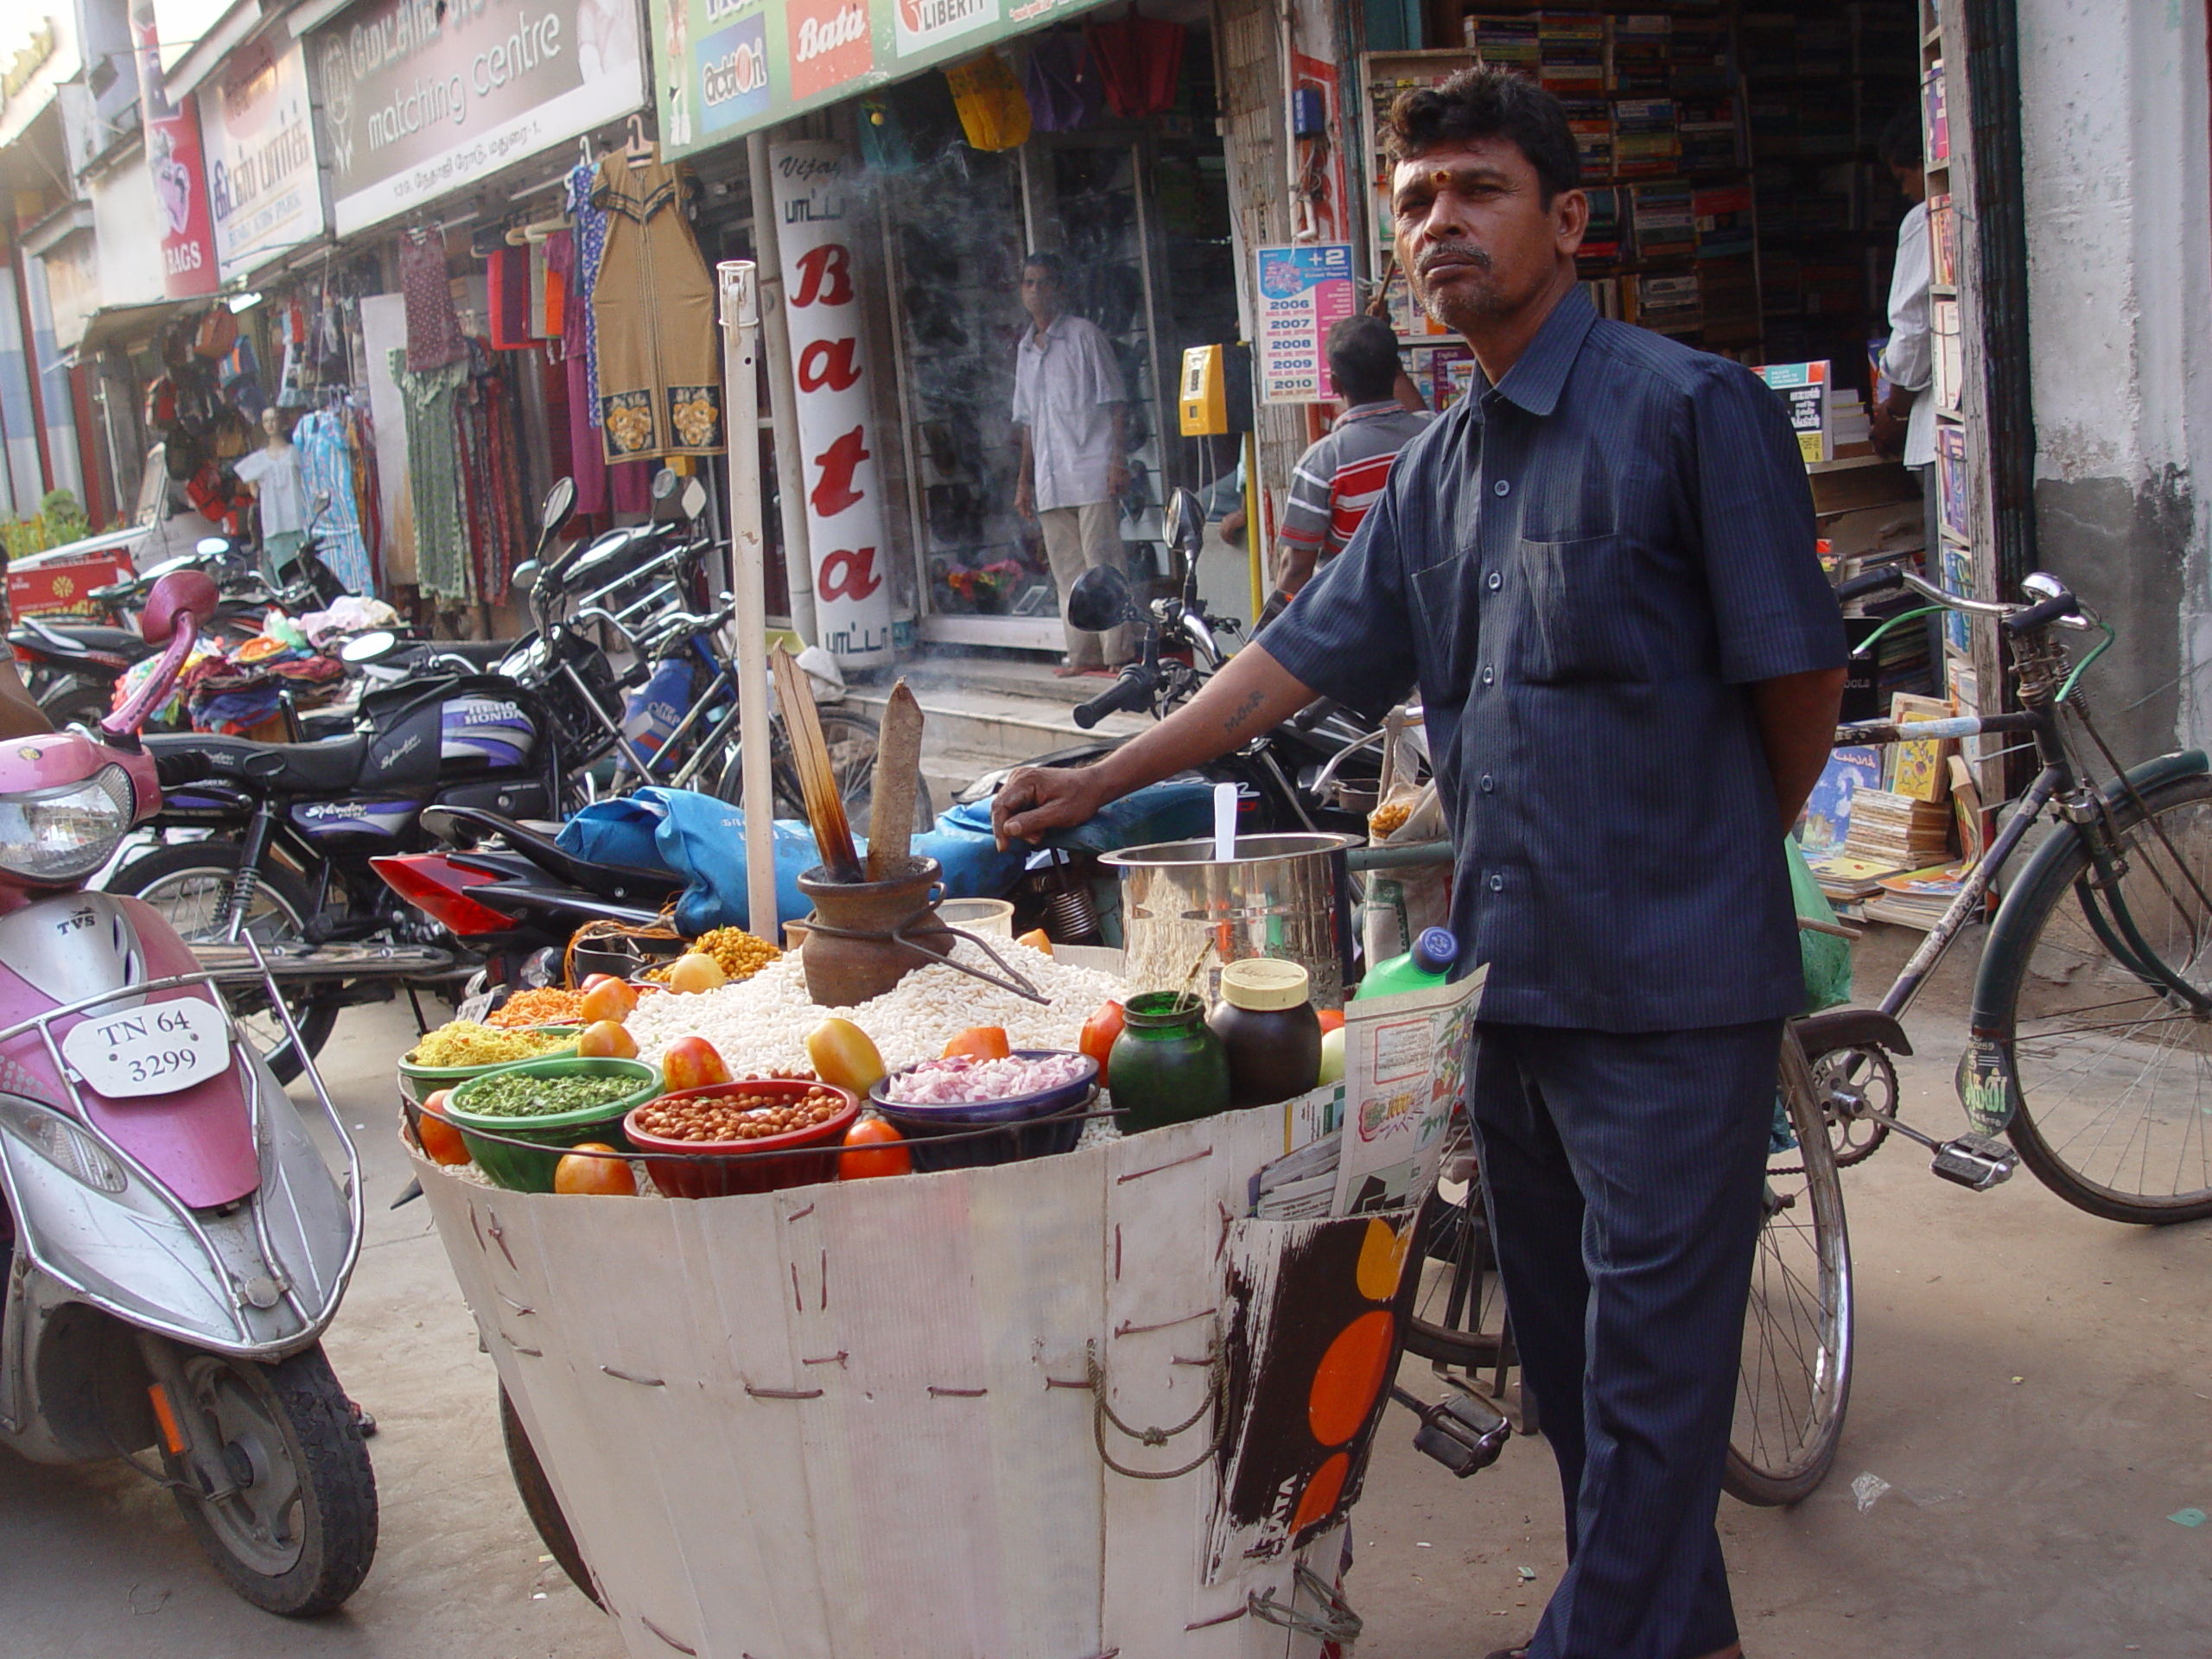

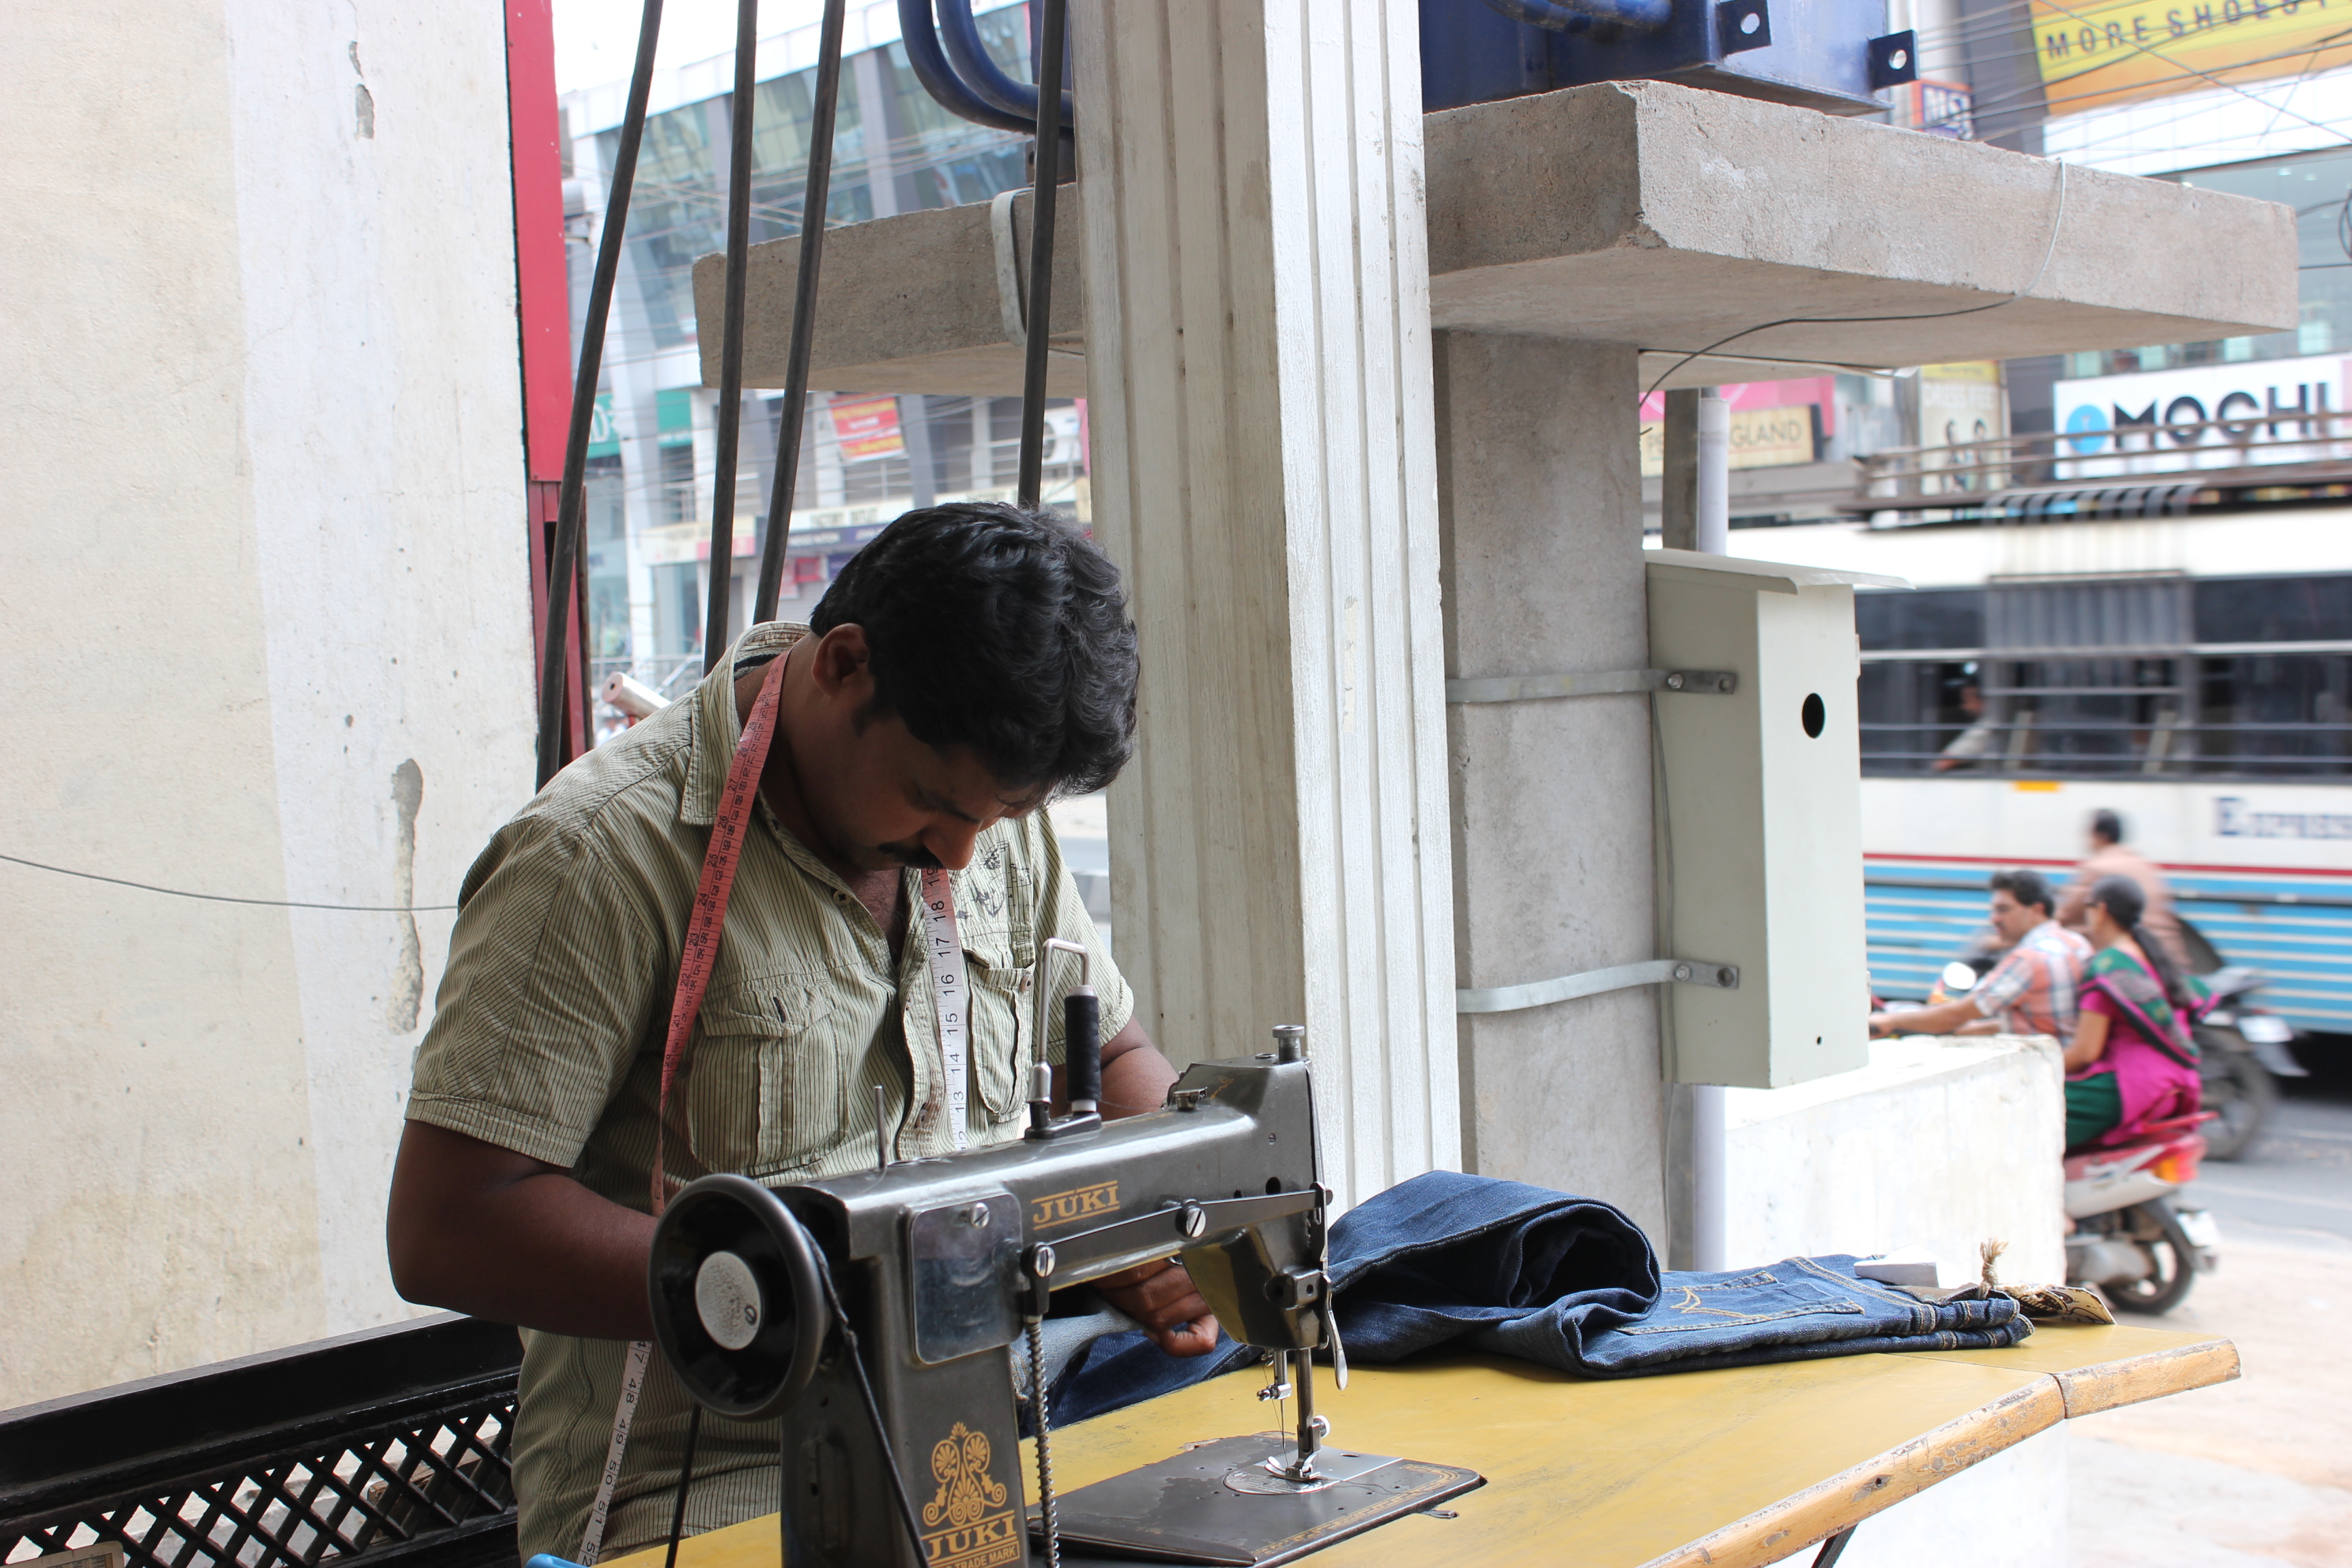
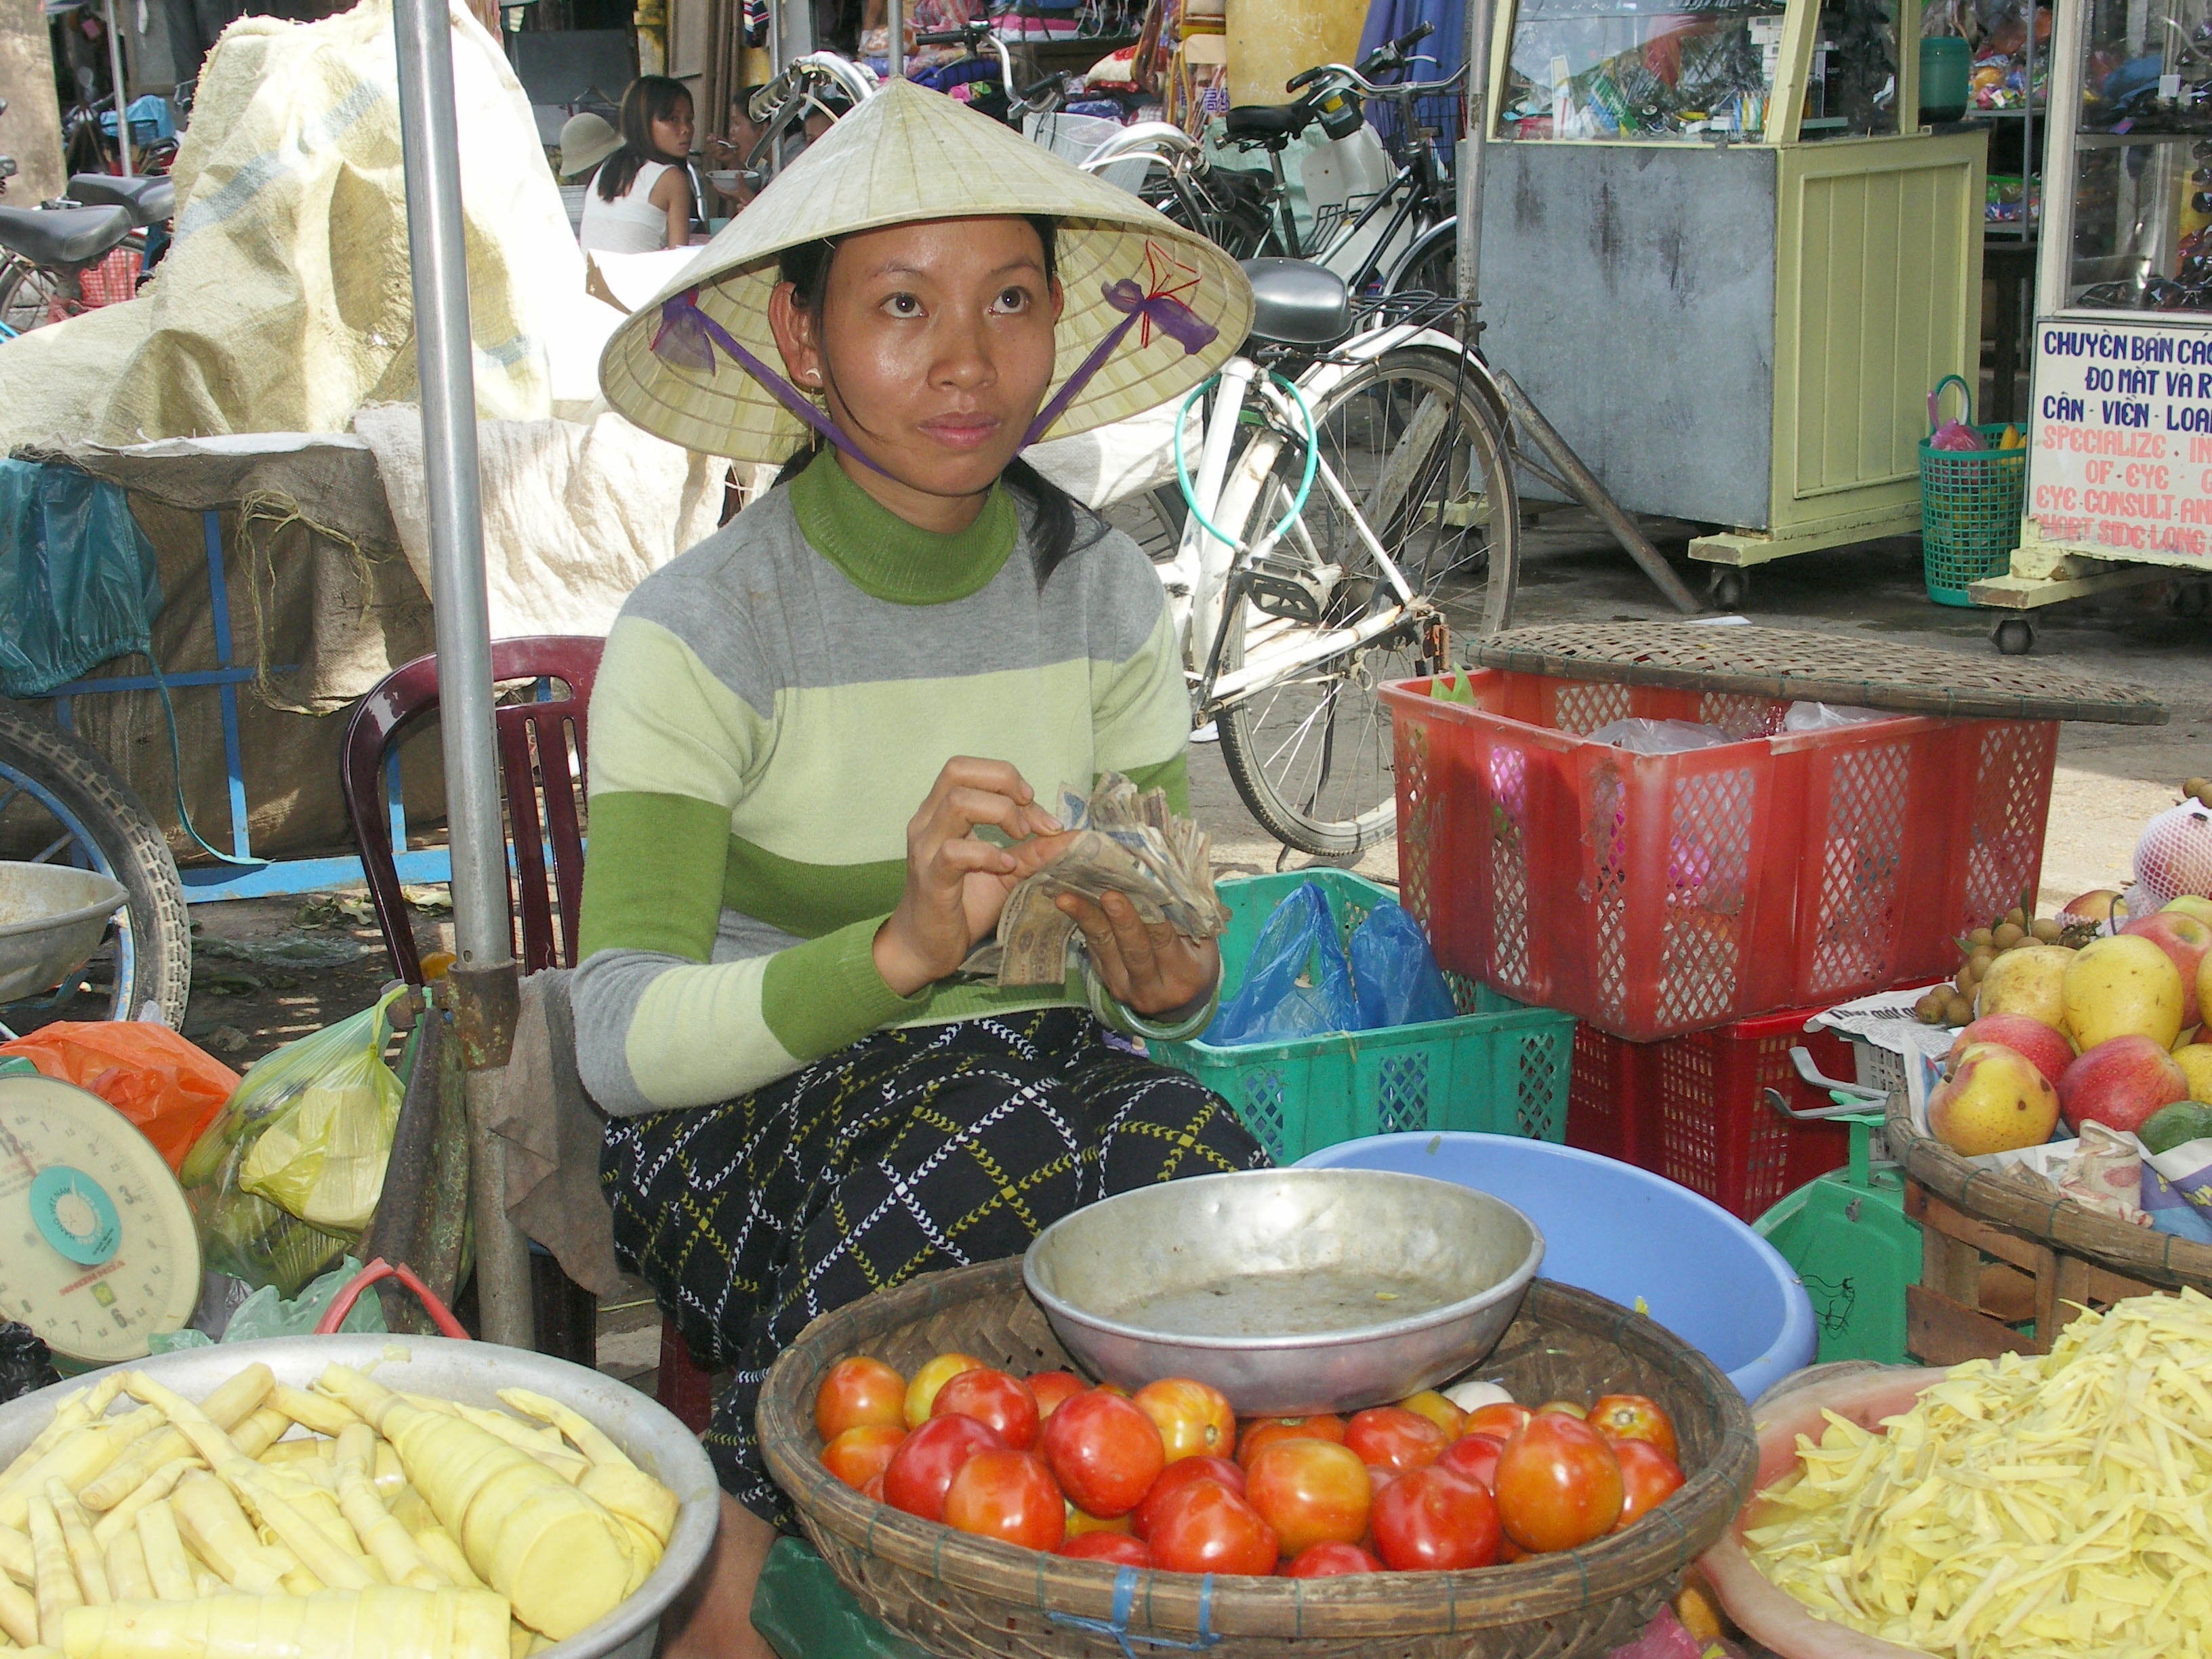
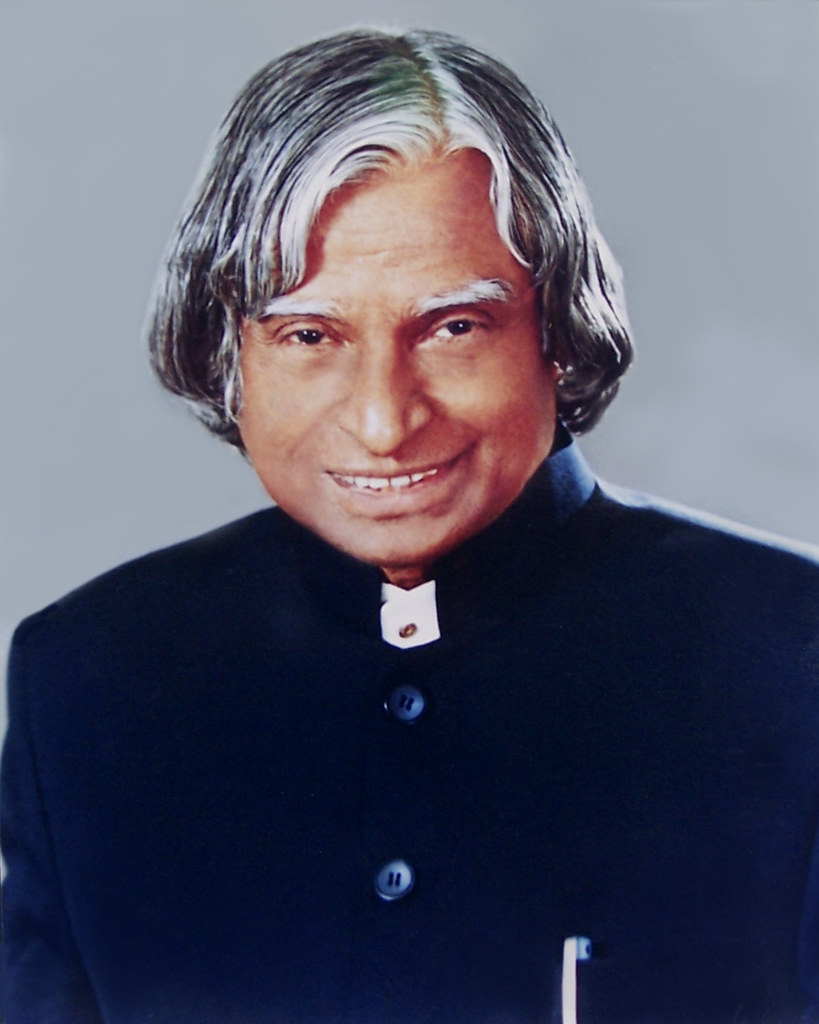
What is the definition of an entrepreneur? The dictionary definition goes like this- “a person who sets up a business or businesses, taking on financial risks in the hope of profit.” Literally, a person who runs an enterprise. Now look at the pictures above, can you tell which one of these is an entrepreneur?
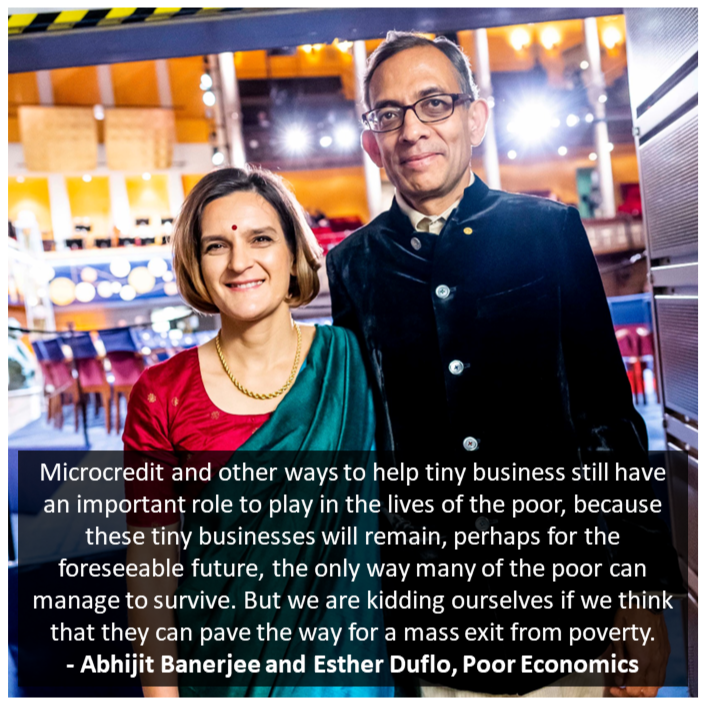
This will make us realize that how the glamour built around the word entrepreneur is actually a mirage. The basic idea in entrepreneurship is the risk taking for the gaining profit. We are surrounded by such small entrepreneurs in our day-to-day life, most of these are poor entrepreneurs. World renowned Nobel laureate economists Abhijit Banerjee and Esther Duflo have contributed to uncover the reality of such poor entrepreneurs and many questions associated with such poverty.
Why should one be interested in poor entrepreneurs?
According to the data collected by Abhijit Banerjee and his team roughly 12% of the population in rich countries calls themselves as self-employed i.e., entrepreneurs. The interesting thing is that the poor countries have far higher percentage of self-employed people. Nearly 70% people call themselves entrepreneurs – self-employed in poor countries. These are the people who are mostly single person entrepreneurs like tailors, bricklayers, auto-drivers, street-vendors, shopkeepers.
“…most income groups in poor countries seem to be more entrepreneurial than their counterparts in the developed world-the poor no less so than others… ”
Abhijit Banerjee and Esther Duflo, Poor Economics – rethinking poverty and the ways to end it
Looks like bigger chunk of the entrepreneurial population of the world is not really glamorous and full of revenues, capital and resources. The intention to focus on this information is not to degrade entrepreneurship, rather it is to understand why the percentage of entrepreneurship is huge in poor countries where availability of resources and capital is already hitting rock bottom low? How do they manage such ventures in low margins? Do these entrepreneurial ventures bring them out of the poverty? If yes then, how? If not then why?
If entrepreneurship is supposed to give people freedom to operate on their own conditions, freedom to be their own boss, freedom to take control over their own lives, bring their ideas into the society then why poor countries where the entrepreneurial fraction is huge are not coming out of poverty? Why most of such poor entrepreneurs remain poor even after embarking on the journey of self-employment?
Trust me the answer is not related to ‘lower rates of returns’ only!
Ingenuity of the Poor Entrepreneurs
Let us understand the challenges faced by the poor entrepreneurs listed as below:
- Being poor, they are inherently low on capital (obviously)
- They have low or no access to formal financing institutions like banks, insurance companies
- As they have no access to formal finance, they approach local moneylenders and borrow with high rates of interest
- They have very low risk-taking capacity because any investment other than that for sustenance is a survival challenge
- They have very crude social support in terms of materialistic and emotional levels. They are surrounded by people having same difficult lives. They rarely have good connections with people who will trust them, people who will have access to better conditions capital-wise or relation-wise
Even after having these challenges, the fraction of entrepreneurs in poor countries is surprisingly high. How is this possible?
As Abhijit Banerjee explains, the poor entrepreneurs have clever ideas to run their businesses even at low capital. The unavailability of resources, material/ capital means forces them to find out new creative ways to make living. You will see many such innovative entrepreneurs around who try to make living by using some really interesting ideas e.g., the human hair collectors roaming around town to exchange with utensils/toys, the scrap collectors who collect specific types of waste only and sell them to bigger scrap dealers in bulk, there are some dust collectors in the gold markets of many cities in India where poor people collect road dust around the gold shops and try to extract tiny amount of gold from such collected dust to sell it.
But how many of these innovative, creative and ventures with true ingenuity actually turn into a unicorn or a big company? In simple words, one knows how costly are the hair extensions/ wigs are then why the hair collectors are not getting rich with their business? If gold is that precious then why these dust collectors are not getting rich with this gold dust collection ventures?
This is where the insights created by Abhijit Banerjee play a very vital role. In his book “Poor Economics – rethinking poverty and ways to end it” co-authored by Esther Duflo, he has given very important insights into the world of poor people, the challenges they face and ways to uplift them.
Let us deep dive into the key concepts to understand the economics of such entrepreneurs.
Representation of the Poverty
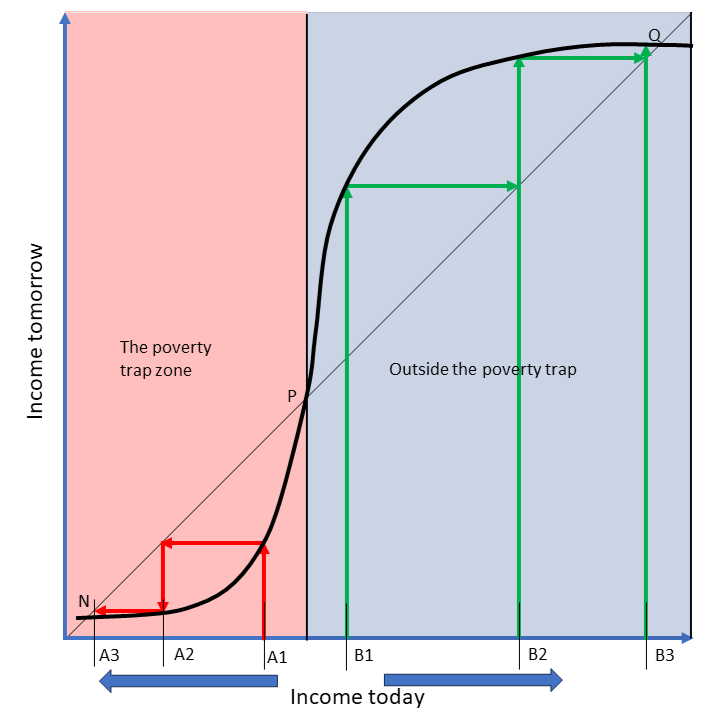
Source: Poor Economics – rethinking poverty and the ways to end it by Abhijit Banerjee and Esther Duflo
Economists use the diagram shown above to indicate the relation between income of today and the income a person will earn in the future. You will see an S -shaped curve forming. The red zone indicates the poverty trap zone where a poor person starts from A1 earns a meager amount which is not enough to sustain making the net income negative thereby proceeding to A2 which is backward directed/ decline in income. This reduced income restricts his/her freedom to choose (as the words go “beggars cannot be choosers”), risk-taking ability, reduction in available capital thereby scarcity of capital disposable to meet the daily basic requirements. So, the ventures in which poor people are engaged are down-valuing ventures according to this representation – which is used to represent “The Poverty Trap”. For those who think that the ventures of poor people always end up in losses thereby degrading their existing states, this curve in red zone represents that vicious cycle.
Most of the economists think that poverty is not a vicious cycle. By providing minimum enough capital/ resources to the lowermost group, their lives can be kick-started where the ventures will give net positive incomes, thereby gradually increasing their income over the time. That is why the world around us is explained by blue shaded part of the diagram, known as inverted L-shaped curve.
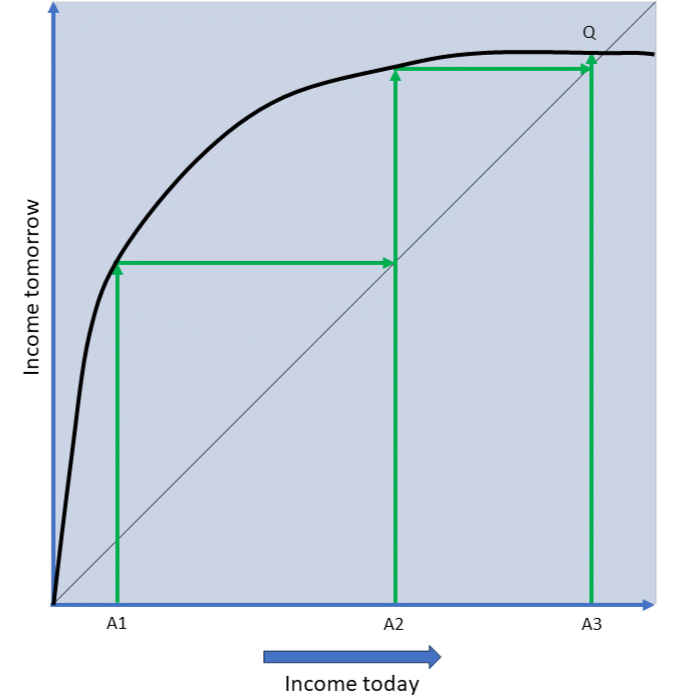
Source: Poor Economics – rethinking poverty and the ways to end it by Abhijit Banerjee and Esther Duflo
Please note one interesting detail in this diagram which we will bring further in our discussion. The initial slope of the curve is steep indicating substantial valuation increase in income but as the curve proceeds slope of the curve ends into flat thereby indicating less or no increase in valuation of the income over the longer period.
In very simple words, a venture can only sustain over the time if there is some net gain over the time (always remaining net positive, even if it becomes smaller and stagnant over time). Very few people and actually no one would engage in a venture where they see their future valuation, future earnings dropping over the long-time horizon. That why most of the economist accept Figure 2 to represent the incomes of today and tomorrow for anyone.
Asking the Right Questions
Now that we have realized that it will take very small amount of effort and capital to uplift the poor entrepreneurs why doesn’t that help them immediately? Abhijit Banerjee in his studies asked some important questions which reveal why just giving poor enough money won’t solve the complete problem. Abhijit Banerjee clarifies that it is the inherent nature of the enterprises/ businesses, societal conditions and even the mindset of the poor entrepreneurs that makes them stagnant in their ventures. Even if they are running their small businesses successfully, they will always make just enough to sustain in long time horizon, very few will be the outliers which come out of this stagnancy.
Abhijit Banerjee pointed out that most of the poor entrepreneurs repay their loans on high interest rates. The high returns rates are attributed to the lending from informal financiers like local money lenders, relatives. If poor entrepreneurs are successfully repaying such high interest loans while sustaining through the business, then that means that their overall rate/ fraction of earning for the capital invested is also very high.
So, why don’t they become relatively wealthy even after running business with high rate of overall returns?
Here we can take support of the inverted L-shaped curve for poor entrepreneurs and build on that further.
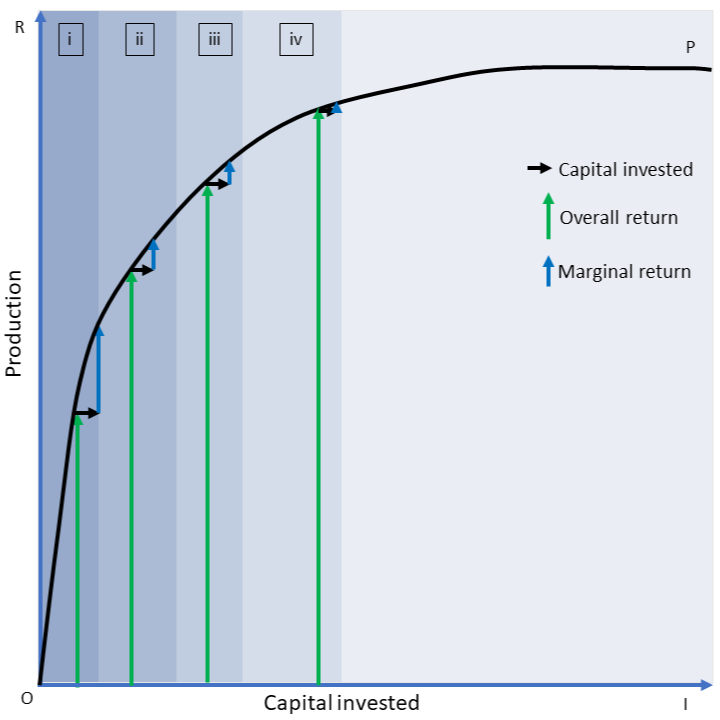
Figure created from the explanation in the book Poor Economics – rethinking poverty and the ways to end it by Abhijit Banerjee and Esther Duflo
Abhijit Banerjee explained the reasons for the stagnancy in poor enterprises in practical ways based on his field research. He explains the important behavior of marginal returns in terms of the poor enterprises. Marginal returns are the what left after an entrepreneur pays off everything – like payment on tools, payment of the wages to the workers, payment of the things bought to sell. Marginal return is take-home money after the business is done.
Now let us see the inverted L-shaped curve in figure 3 for poor enterprises. At the start of the business the marginal returns (shown as the height of the vertical blue arrow) are very high for the extra capital invested (shown as the length of the black horizontal arrow). The early investments in the business yields higher returns – higher marginal returns.
But, as the curve proceeds, due to the inherent nature of the businesses poor entrepreneurs are involved in as the capital investment goes on increasing, for every unit increase in such investment the marginal returns go on reducing and diminish further.
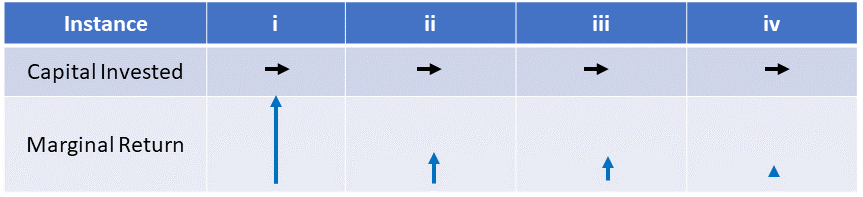
You can see in the figure 3, there are four different instances of extra capital investment in the poor enterprises. The L-shaped curve increases rapidly at early investment stage but as the capital investment goes on increasing the curve quickly flattens out, indicating the stagnancy.
This behavior can be explained by the example of local fruits and vegetable vendors. First a person starts out with very few 2 or 3 vegetables (potato, tomato, onions for example). Being the commodity vegetables, they are sold very easily, fast and margins are also pretty good for the amount invested to buy them in wholesale. So, with those good returns he/she now buys different vegetables and now provide more options to his/ her customers. Now you will realize that not everyone buys every vegetable he/she has to offer, the sell of potato, tomato, onions may still remain good. But in order to expand he/she cannot depend on selling those only, and as he/ she expands into new varieties there comes the uncertainty of not everyone buying it. Perishable nature of these products is also one problem over which he/she has no control. The overall return may increase by incorporating more variety of items or by buying a cart to access many customers but for every new investment further done to grow this business, the guarantee of higher returns is very low.
So, the vegetable/ fruit vendor realizes this at a stage in his/her business that buying only those items which would sell, items which will not perish immediately with limited customer accessibility through cart is the only option to survive. You have to understand the limitations created by the nature of the businesses poor entrepreneurs are invested in.
That is exactly why only giving money to poor entrepreneurs won’t bring them out of the poverty. The businesses they can perform stagnate very rapidly.
Now, someone should ask the question for the case of the vegetable/ fruit vendor.
The questions could be asked as follows,
- The vendor should buy a vehicle so that he will contact more customers, why doesn’t he / she do so?
- The vendor should go to the wholesale market to buy the vegetables and fruits even at low rates to increase his margins, what stops him/ her?
- The vendor should rent a place in cold storage to maintain his items fresh till they are sold to the end customer, what is the hurdle?
Now, let us assume ourselves as this vendor and try to answer these questions.
- If the sell is stagnant even with a cart, why should one put exceedingly high amount in a vehicle purchase. This will be a big capital step. As the accessibility to formal lending is difficult, it brings capital in but the returns will be very low due to the borrowing at higher rates of interest.
- In order to buy at wholesale low rates connections with the wholesale tycoons are vital. Such connections are based on mutual benefits which the poor entrepreneurs hardly have access to.
- Cold storage rentals are significantly high for the amounts they earn so that goes there.
You must understand that these are not some contrived examples created to prove certain points. These are real life challenges and questions faced by poor entrepreneurs. It is only because of such challenges the poor entrepreneurs have that creative mindset, low cost, less capital-intensive problem-solving mindset. This also the reason economists found that poor entrepreneurs have very low number of people involved per business, they cannot afford to employ others due to the stagnancy.
As the study done by Abhijit Banerjee indicates, even if you provide some extra marginal income to the poor entrepreneurs so that they can access such options where extra capital is required, they will still choose to not invest that extra amount in the business because they know that for that extra investment the returns will not be that high over the longer period. (Abhijit Banerjee experimented with such extra capital provisions to poor entrepreneurs in Sri Lanka through lottery system, these entrepreneurs chose to invest that extra money in their livelihoods instead of businesses)
The Big Gap to Fill
Now you should understand that even when extra capital is provided, that extra capital definitely won’t go into the growth of the poor enterprises. The question now comes that why poor entrepreneurs don’t have wide mindset? Why can’t they think big? Looks like the horizons and the mindset of poor entrepreneurs are so narrow that they are scared of risk taking. For the exact reasons the micro-financing institutions have tried to disseminate finance education, entrepreneurial education to the poor entrepreneur they lent money. But economists found that it is the inherent nature of the enterprises that poor can and are involved in, which makes them to think so.
Abhijit Banerjee here clarifies what exactly is the difference between the poor entrepreneurs and the rich entrepreneurs. For that let us look at the figure 4
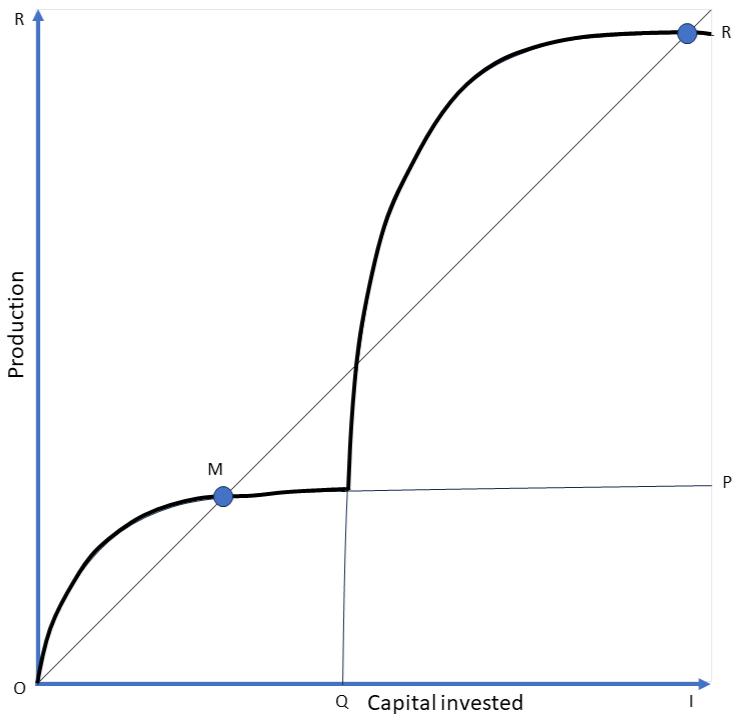
Source: Poor Economics – rethinking poverty and the ways to end it by Abhijit Banerjee and Esther Duflo
You must appreciate the beauty with which Abhijit Banerjee has explained the difference between poor and rich entrepreneurs. Any incorporation of production technology in an enterprise will improve the productivity. Buying machinery, tools, infrastructures can largely boost the business performance. This boost due to production technology is shown as curve QR.
What does the curve OP represent?
As you have already seen, curve OP starts with no to less capital investment and flatten out immediately. It is the curve of poor entrepreneurship.
Now you must understand that in order to gain marginally/ exceptionally high returns one needs to start with high up-front capital in hand (Indicated as capital OQ). The big tech startups, the big supermarket chains start exactly from here where there are high chances of success (This is also why rich start-ups or any non-poor start-ups demand high funding).
In the case of high marginal returns in poor enterprises in their early stages of development we can easily think that high marginal returns should create the foundation of a successful long-term business. These high margins will allow the person to invest more in the same business, to employ more people to expand the workforce, to purchase new machinery, new tools. But these high marginal returns could never fill that capital gap for poor. This is what majorly differentiates between poor and rich entrepreneurs.
So, one has to really appreciate the gap lying between poor and rich entrepreneurs. This gap of capital to create production technology is too large for poor entrepreneurs and for the business they run. It is not just their narrow mindset, rather they are so close to the harsh reality that they prefer not to follow such seemingly “imaginary” paths.
Conclusion
Entrepreneurship for our young generation seems like a glamorous venture with big money, new technologies, new ideas, new technologies, “angel” investors and “unicorn” start-ups but we always forget that we are surrounded by many entrepreneurs which go unnoticed and have less to nothing to do with the keywords explained here.
A high chunk of these unnoticed entrepreneurs are poor entrepreneurs. They are part of our lives in a big way – you can think of the vendors of every small thing you use in your whole day.
Most of the people in poor countries are self-employed or entrepreneurs. This proportion is far less in developed nations.
Poor entrepreneurs seem to make high returns in their business but most of those high returns go to the repayment of the loans at high interest rates due to the inaccessibility to formal financial institutes which can lend at relatively lesser rates of interest. These businesses are very small and unprofitable over the time even though the rates of returns are exceptionally high.
Providing capital and opportunities to poor to start their business is not the solution to their improvement. Even after such provisions they will engage in the enterprises which rapidly stagnate over the time.
In order to come out of such stagnation they will need to fill that huge gap capital to incorporate production technologies which is impossible without the involvement of anti-poverty policies which will create opportunities and involvement of big formal institutes to provide no risk capital.
“The idea of the entrepreneurial poor is helping to secure a place within the overall anti-poverty policy disclosure where big business and high finance feel comfortable getting involved.”
C. K Prahlad, taken from the book Poor Economics by Abhijit Banerjee and Esther Dulfo
Poor entrepreneurs have less risk-taking ability, no to less business connections, no credit/ loan capability when compared to their rich entrepreneur counterparts. They have to fill that huge gap of up-front capital which could have brought new production technology, employed more skilled labor. Filling this high capital gap is impossible for poor entrepreneurs. That is exactly why a smart, ingenuous street vendor even while having the best and the original ideas cannot expand his/ her business into big industries, companies and malls.
When we are understanding that poor enterprises rarely promote multiple employment/ connected employments, we should understand that supporting the poor entrepreneurship won’t drastically improve the employment rates of the nation, especially the poor nations. This is also why creation of good jobs is very important.
References:
- Poor Economics – rethinking poverty and the ways to end it by Abhijit Banerjee and Esther Duflo
- MIT OpenCourseWare – 22. Entrepreneurs and workers – Lecture by Abhijit Banerjee
- 106 Must-Know Startup Statistics for 2023
- 90% Of Startups Fail: Here’s What You Need To Know About The 10%
- News reference – Sifting through sludge for a sprinkle of gold – The Times of India