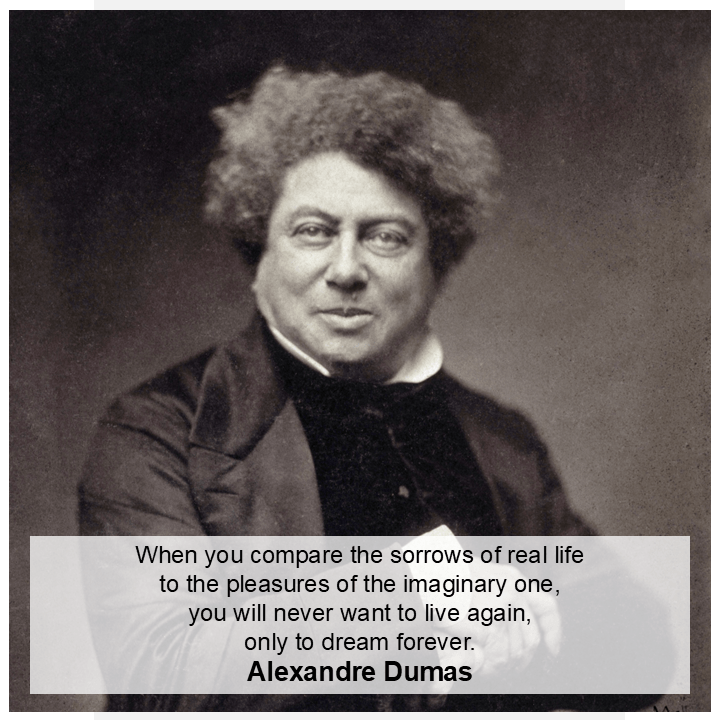
People have tried to justify their existence with happiness, fulfillment, satisfaction, service, love, hope, devotion and what not. But those who have existed in full spirit, lived it to the fullest have realized the effect of sufferings on our lives and even after overcoming them are ready to endure them again in the hope that they will become better than what they were before. These are the people who might have solved the query to justify the life. Overcoming the sufferings in life and continuing the journey ahead could be the answer.
On Charles Dickens’s short story – A Child’s Dream of A Star
The Impact of Suffering in the Pursuit of Happiness
Question- what would you choose of the following?
A short life filled with happiness and satisfaction? or A long life filled with pain and suffering?
I will assume that you have selected one.
Charles Dickens’s short story – A Child’s Dream of A Star
I came across a short story “A Child’s Dream of A Star” by Charles Dickens which shows what it means to pass through the suffering of the lost loved ones.
This is a story of a boy who loses many loved ones throughout his whole life. Whenever he is losing someone, he dreams of a star where he sees the souls of his loved ones meeting and coming together. First, he loses his little sister in childhood, then his baby brother. When he grows young, he loses his mother, while being adult he loses his own daughter. Every time, when the boy loses his people, he dreams of the same star and wishes that he too could join them. But, when grown adult and losing his daughter he is somewhat soothed that his daughter is not alone, she has the angels of his sister, mother and brother to accompany her.
When he realizes the arrival of his last moment, he accepts the death for the joy that he will join the souls of his loved ones now.
The Suffering of Watching People Leave
Charles Dickens in a very impactful way shows what it means to live life. On surface analysis, one can say that this short story of a boy dreaming about the people he lost and asking for his own death in the hope to join them is about the pain of losing the loved ones and dissatisfaction of not getting enough time to spend time with them and love them. Deep down it is about how one endures pain and I think the only way to endure such pain is to pass through it. Any attempt to alleviate or even control it, leads to more pain.
Enduring the Suffering
The great thing about this story is that it delicately captures what a beauty that life we live in is and how we connect same attributes of life to the afterlife (even when we are unsure whether it truly exists, even when it exists in our minds and dreams) also how fragile our existence is.
Charles Dickens used the innocence of the child’s mind to show how we carry that innocence throughout our life to use every chance to stay closer to the people we love. The opening of the story also talks about the sorrow that is felt by everyone when someone dies.
“They used to say to one another, sometimes, supposing all the children upon the earth were to die, would the flowers and the water and the sky be sorry? They believed they would be sorry. For, said they, the buds are the children of the flowers, and the little playful streams that gambol down the hillsides are the children of the water; and the smallest bright specks playing at hide-and-seek in the sky all night must surely be the children of the stars and they would all be grieved to see their playmates, the children of men no more.”
It shows that even for children the suffering had a bigger meaning not even when they had faced any such suffering from loss in their tender age. It shows how by default we are hardwired for the sensitivity towards suffering. Maybe we are more sensitive to suffering than love.
Then we see that the boy is exposed to multiple losses and you will see over the time his dreams are evolving gradually. In early childhood loss of his sister, he is totally devastated that he could not join his sister, then he is again agitated with the thought that his younger brother has to join her in the starry heaven. Then when he is young, he is somewhat settled that his mother could join his sister and the brother.
Now when being adult and losing the beloved daughter, the same boy has made peace with her death in the thought that she has enough people to take care of her and maybe love her more. Now he has made amends with the death.
“My daughter’s head is on my sister’s bosom, and her arm is round my mother’s neck, and at her feet is the baby of old time, and I can bear the parting from her, God be praised!”
You must understand how the boy from childhood till his old-age sees the death in different ways. At first, he has intense sorrow for his sister but over the time he sees that even after death the people he loves have each other’s company.
He cannot do anything to join them in the afterlife and death is the only way to join them. Please note that there is not even single mention or any indirect indication that boy wishes to end his existence just to meet his loved ones in afterlife.
So, it’s a story of how a person builds himself towards the suffering. You will see that the boy never gets numbed because of the series of losses, he is hopeful that at least someone is there in afterlife for them to love each other. Death along with love is the only constant in this story.
We are well aware of the love from the very beginning of our existence but it takes time to appreciate that just like love, death too is eternal. It’s just that our minds find it difficult to bring together the idea of eternal nature of love and never-ending series of death in single thought. Maybe that is why not everything exists at exactly the same time and ends at exactly the same time, otherwise there would be no one to witness and appreciate what one existed in and carry that forward.
The Eternal Curiosity, Innocence and Love
I am adding the concept of eternity, endlessness in this story of involving series of deaths, ends and sadness with it, because that is how the life is. The symbolism of star used in this short story by Charles Dickens also points to that idea.
You should notice that in the opening it is about how everything that is there in existence will feel sad for loss of the children of men. The boy feels that sorrow in his childhood; later on, we realise that he holds these unfulfilled emotions, feelings of not getting enough time to spend with the people he has lost. These emotions are continuously getting reflected in his dreams. In the end, we see that he is dying happily while feeling that he can love them again in the afterlife.
But you should now notice that the dream is limited to the boy only. What is real is the star in this story; the star shining on little sister’s grave and was still shining on her brother’s grave who died at old-age.
Just like the children’s curiosity about whether the nature grieved for the losses in the beginning of the story, we can say that the star (being the child of nature) would also grieve for the people he saw dying. But that is not where the story is going. The boy had learned to handle the grief over time and that is why is mature emotionally with the death of his daughter and even his own death. This became possible because his love for his sister increased multiple folds, got intense over the time.
The maturity that comes to such sorrow is worth noticing, the boy now an old-age man is not sad because he will be leaving his children behind. He is neither happy that he will join his loved ones in the afterlife (although what he says while dying means that he is eager to join afterlife).
The star was a construct of his mind to move over the grief and be assured that no one – not even him will never be left unloved. He had a strong belief that at least love is eternal in some or other forms. The star still shining upon his grave in the last sentence of the story is thus the symbol of the child’s innocence and love.
The last words of the boy/ man are these:
“…My age is falling from me like a garment, and I move towards the star as a child. And O my Father, now I thank thee that it has so often opened to receive those dear ones who await me!”
We all can appreciate that the afterlife’s notion is only in the boy/ man’s dreams but that does not invalidate his feelings. He is grateful that he had someone to love (although he couldn’t love them to the fullest while living). The childhood innocence and curiosity he carried throughout his life helped him to endure the suffering. Curiosity because of the urge to understand what would happen to the people who die gets materialized in the dreams of the boy and thus he builds his understanding around it. This curiosity emerged because he cared for them so strongly that he was concerned about what would happen to people after they die. Innocence because from childhood till old-age he deeply believes that just like the children of nature, everyone and not only him cared for people, loved them in some or other ways.
Conclusion
Most of the existential queries on human life point to one single question of meaning or purpose or at least worth of the life. Once started, if it is destined to end then why is this everything existing? And this question is not just about life. It is about everything attached to the life itself. If everything in existence is attached to something and everything at any time will be lost forever, disconnected forever then why does everything exist in first place? Once you appreciate this question, you will see that existence is majorly a series of detachments, losses – literally and figuratively. It is just that some things detach faster than others, some things stay for longer time but are lost in the end; we are just existing in these gaps of losses and detachments. Maybe how we felt about those things especially the innocent emotions we had for everything that is there (which are neither good/ bad, pure/ impure) are eternal. If not eternal, I would say that they evolve in better ways, get refined, gain maturity and get transferred to our next generations through our legacy. Maybe they too would have an ending but what can we say about the human spirit! The spirit to exist in spite of the sufferings! The ability to exist in full spirit and endure multiple sufferings over the time while maintaining that innocent child alive inside you is what justifies our existence in the end. And even that is to end in the end, I have no complaints.
So, when I asked to select one of options at the start, if you felt that selecting only one of these is foolish (or difficult/ meaningless) then welcome to the club!
People have tried to justify their existence with happiness, fulfillment, satisfaction, service, love, hope, devotion and what not. But those who have existed in full spirit, lived it to the fullest have realized the effect of sufferings on our lives and even after overcoming them are ready to endure them again in the hope that they will become better than what they were before. These are the people who might have solved the query to justify the life. Overcoming the sufferings in life and continuing the journey ahead could be the answer.
When it comes to psychology – people consider Sigmund Freud and Carl Jung as the de facto rock-stars of the field of psychology. One unnoticed person whose findings deserve equal attention rather more attention was Alfred Adler. He introduced the Individual Psychology to the world which is relevant still today and is way more sophisticated to solve the “so called” troubles of our life. Individual psychology makes a successful attempt to reach to the roots of our suffering and allows us to become truly free.
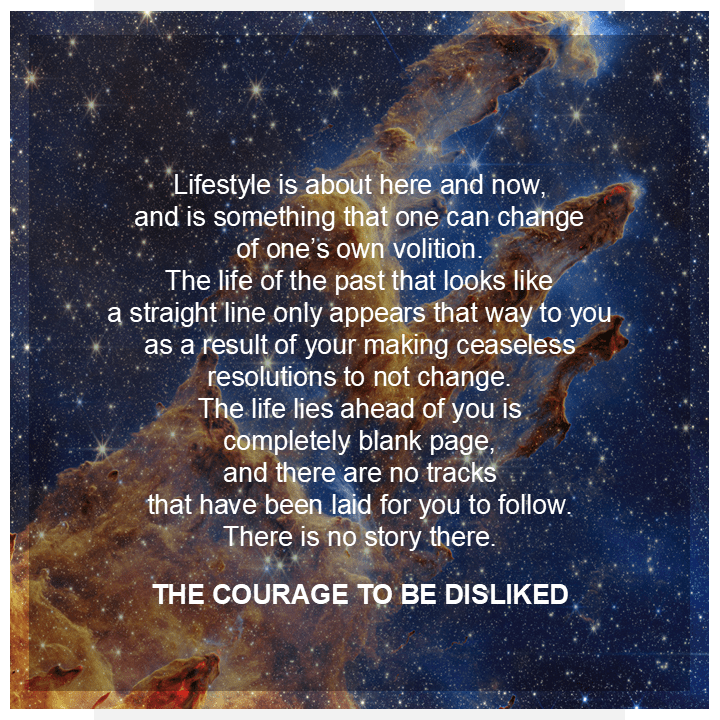
Alfred Adler’s philosophy is beautifully explained in Ichiro Kishimi and Fumitake Koga’s book “The Courage To Be Disliked”. It talks about the feedback loop of self-acceptance, confidence in others and contribution to others to live a real and fulfilled life. The great thing about individual psychology is that it urges us to break the notion of causality and thereby determinism to come out of the painful, suffering inducing cycles of life & death, cause & effect. It shows us that we live in the universe with infinite possibilities and one needs courage to break the logic of determinism to truly appreciate themselves and the infinite possibilities universe has to offer. Individual psychology given by Alfred Adler thus asks us to bear the courage to lose the false-comfort given by causality – predictability and decide our life on our own terms fearlessly and with freedom. It teaches how one can be completely involved in everything but not attached to them at the same time.
On the book – The Courage to be disliked
‘The world is simple, and life is too.’
I have a question for you,
– How is life treating you right now?
Everyone knows that the responses to this question are diverse and dynamic. The answers obviously will be subjective and so it is normal to expect huge variety.
But you know what, deep down everyone (mostly the adults) know the most frequent type of the answer to this simple question. There is innate predictability about what the answer could be.
Life is not treating me fair
Life has become too complicated for me, life is suffering, there is no hope, why can’t I have a single moment of happiness to savor for some time? why do bad things happen to only me? what have I done wrong to someone that ‘everyone’ has turned against me? what should I do – now that I have not achieved what I was supposed to achieve in spite of putting all honest efforts? why is ‘everyone’ – the society always against me when all I have for others is good will?
Deep down we have this undeclared, unexpressed notion that something wrong happened to me which I didn’t deserve. I tried so hard but couldn’t achieve that thing. Trust me every one of us is an expert of hiding these unsettling feelings, overlooking them to move ahead. But it is important to understand that unknowingly they become part of who we are. When we truly and honestly would start inspecting ourselves, we will find these feelings being the reason for the bitterness we carry inside. That is why life is suffering for most of us, being free then is out of the question. First let me be happy for now!
Psychology has always been on the quest of resolving the model of how our mind works. A bigger portion of psychology directly or indirectly works towards understanding how we see happiness and suffering. Because, end goal of how we feel, how we think, how we decide, how we interact, how our personality is created is emerged from either a happy event or sad event which affect why our psyche is in a certain way.
When it comes to psychology – people consider Sigmund Freud and Carl Jung as the de facto rock-stars of the field of psychology. One unnoticed person whose findings deserve equal attention rather more attention was Alfred Adler. He introduced the Individual Psychology (Individualpsychologie) to the world which is relevant still today and is way more sophisticated to solve the “so called” troubles of our life. Individual psychology makes a successful attempt to reach to the roots of our suffering and allows us to become truly free.
I appreciated this in deeper sense when I came across a book called “The courage to be disliked”. A single book can change your life. Although I have been changed many times before, I couldn’t help but overstate the importance of this special book.
This is my attempt to reorganize the ideas from the book to instantly simplify the core ideas. So, the next discussion may spoil the book for you. (Although it’s not a story book having a climax at the end but the ideas are written in a conversational – dialogue format so, you peel out one layer at a time to reach to the core ideas of individual psychology.)
I am actually spoiling the whole book and my writing on the same heron with these few sentences:
The whole thing boils down how you honor this current moment and not let it be influenced by the fear of past and the anxiety of the future. This complete dedication to the current moment is only possible if you honor yourself first, because only you can experience how this current moment will turn out for you. The moment you start to respect this moment here and now – you will be free.
If you have the ability to love, love yourself first
Carl Jung
Now that I have already explained what life ultimately boils down to, it will be important to understand why these sentences hold some gravitas. So, thanks for continuing with me hereon.
Deny trauma – Deny the comfort of causality
The core of individual psychology is the rejection of the causality. Our complete understanding of ourselves and the world we live in is based on the notion of cause and effect. It does immediately feel silly to reject that exact notion thereby making individual psychology illogical.
You will appreciate that not everything in whole can completely be justified or predicted with complete precision using the logic of cause and effect. There will always be some information that cannot be completely known for the given system (Heisenberg’s uncertainty principal points in the same direction). Our mind always makes decision, assumptions based on the current information, experiences we have till date and every one know that it is impossible to have all the information and all experiences that are there in the world for a person to understand his/her own existence.
So, in simple words – ‘who we are’ goes beyond the logic of cause and effect. You can be free once you break the chains of cause and effect. In the universe filled with infinite possibilities, there will always be something wrong and illogical, totally disconnected justification to the things happening to you and around you. It will be an injustice if you let that illogical justification define your whole upcoming life.
When we say that I became a person like this because something happened to me in past where I learned my lesson and changed myself into something else, we are just trying to convince ourselves to do things in certain way so that we will have less resistance to get things done in our ways. That is exactly where problems start emerging.
We crave for causality because it grants value to past; because it taught us some valuable outcomes and same causality can help us to predict what would happen in future. We always crave for certainty. But all of us know this by experience that we are rarely good at predicting our future. This furthermore unsettles the mind.
So, trauma is the pre-side-effect of causality (the post-side-effect of causality is the anxiety of the uncertainty of the future). We carry our traumas as badges to flaunt because these traumas feel very personal thus exclusive. The ways in which we carve out our personality from these traumatic experiences gives us a sense of special-ness. These bad experiences, traumas are a big part of our personality maybe due to a survival mechanism implying ‘I should be able to cope up with similar thing if they happen to me in future.’
See, the point is that if we stick to our traumas and fixate our personality on the same, we will never be able to explore the concepts that had better potential to improve our personality (and probably not be traumatic, bitter). We will be stuck in that loop of experiences related to that causality. Given that there are infinite possibilities, there is fair chance than we can be even better than what we were and what happened to us in the past. We are just better at finding reasons to justify our current position because we know we are comfortable here.
No matter what has occurred in your life up to this point, it should have no bearing at all on how you live from now on.
It might seem that when we are rejecting causality, we are choosing a non-nonsensical path. In reality, we are just avoiding the ways in which we are always fooling ourselves to remain in comfort of predictability. Using the excuse of causality, we are actually ‘inventing’ non-real reasons which hide the realest reality we can actually live.
The first principle is that you must not fool yourself and you are the easiest person to fool.
Richard P. Feynman
Once you deny this causality which you think made you who you are, you will immediately see who you really are. You will leave that burden behind. You will accept yourself for who you are. You will see that you can instantly detach yourselves from your past and your future too. The untapped possibilities open up.
This is self-acceptance in individual psychology.
Once you see how important you yourself are to live your own life, you will say –
“Before past and future let me at least appreciate my own current moment”.
That is now and here. Once you come to the terms with yourself you will realize how everyone is just like you even though we are separated by many aspects of life. Then you will appreciate how others have their own current moments to live and experience in their own ways.
All problems are interpersonal relationship problems – others have their own current moments to experience in their own ways
It is fundamentally impossible for a person to live life completely alone, and it is only in social contexts that the person becomes an ‘individual’.
Nobody can deny the fact that our surroundings make us who we are. Our baselines are our surroundings. A human being is the most basic unit of any society. Our understanding and awareness of self is impossible without a response from surrounding. How would you understand who you are if you never received any reaction, feedback from your surrounding? – It will be a delusional existence. You would have had an idea of who you are but would have been far from what is real.
Thus, when you start seeing that your surrounding will always be interacting with you, you will be able to see every reaction – feedback from surrounding especially people can never be completely cut off. This again feels senseless. If you are born alone, leave this world alone then why couldn’t me being alone throughout my existence be more justified? It is because we never had any sense of absoluteness right from our birth and this sense of absoluteness always remains un-achieved, it is just an ideal condition we are always trying to reach. Our core understandings are only possible with the relativeness, comparison of baselines.
That is exactly why even when you are trying to live your life alone, that ‘loneliness’ itself cannot be justified if there is no understanding of what being ‘together’ means. So, there will always be something connecting you to your surroundings. That is where relationship comes in picture. You cannot run away from interpersonal relationship. You will be surrounded by people (or at least what made them you even when you are sitting lonely).
So, when you are appreciating your current moment, it is natural that others will be respecting their current moments. This understanding will make you appreciate the importance of everyone’s being.
This will make the world around you seem less hostile. You will be filled with kindness for others.
So, you must first accept yourself first otherwise you will not come out of the hideous cycle of comfort of predictability, once you accept yourself to remain in now and here you start seeing here and now of others. You start valuing their here and now. That is why you start allowing people to be who they are, you stop expecting from others. You stop expecting your recognition from others, you stop pleasing people for your own good in the end.
Now that you are free from the burden and pursuit of desirable and predictable, anticipated feedback from surrounding you become tolerant of criticism and even dislike from others. That is truly when you are free. I want to focus on my now and here and nobody can stop me from experiencing that. Then you see this as the basic requirement for others too. This is exactly here the person becomes tolerant towards others. People start putting confidence in each other to create that safe space – the real safe space. People start respecting each other’s boundaries because they themselves have understood that they have their own limitations. This creates the sense of camaraderie – society.
It is precisely because we lay a foundation of unconditional confidence that it is possible for us to build a deep relationship.
This is confidence in others in individual psychology.
Discard other people’s tasks – reject the desire for recognition and accept that you being disliked is not in your hands
When you are appreciating your own now and here to its fullest, you will notice how important it is to reject all other distractions to honor this moment. You will limit these distractions to focus more on this moment. This is where you will see that even though we are molded by our society we have limitations and so do the others. So, it is better if one sets boundaries.
Setting such boundaries helps everyone to focus on their ‘now and here’ in deeper and richer ways.
If you are not living your life for yourself, then who is going to live it for you?
When one develops this understanding, they will clearly see what lies immediately in their own control and what not. If you are busy in trying to control what cannot be controlled by you, how would you have enough resources to appreciate your ‘here and now’? That why it is important to not focus on what you can’t control. Those will be someone else’s to control, that is not you task. That is exactly why you cannot pressurize people to do things in your ways. People can have their own reasons, limitations to not do things in your ways. It has to come from their side.
Forcing change while ignoring the person’s intention will only lead to an intense reaction.
Building on this understanding, you will start appreciating how doing what you love and not expecting anything in return is more than enough. You did what you love. Whether to appreciate it and recognize it, praise it is in other’s control not yours. Now that you have accepted yourself, you do it for yourself, then you won’t crave for attention from others, then you don’t crave for superiority, dominance. You come on level to level with your surroundings. You appreciate that whatever one wants to become that journey has to be completed by only them. Then you appreciate how we are trying to please others to get things done in our way when they were never in our control. You let go of the things which you cannot control and start focusing on what you can. That is why it is normal that some people (who were trying to get things done from you in their ways) will dislike you for not doing them in their own ways. This shows that you are honoring your ‘now and here’
The cost of freedom in interpersonal relationship is that one is disliked by other people
Once you understand that it’s normal to be disliked, rather that indicates that we are doing our own thing you will appreciate what it really means to be genuinely be appreciated by society. Then you will feel like transferring this feeling to others too. Now that you have experienced this feeling for yourself, you would genuinely want others to feel that to. The things then you will do for others will have no intent of return because you very well know that returning favor is other people’s task.
If one’s means for gaining a feeling of contribution turns out to be ‘being recognised by others’, in the long run, one will have no choice but to walk through life in accordance with other people’s wishes.
The feeling and act of contribution has to be selfless and this selflessness is possible only when you are valuing your ‘now and here’. If you still are not valuing your ‘now and here’, it is very easy for you to get swayed by the likes of others and then you will end up in pleasing others and whether others will be pleased by what you did for that recognition is not in your control. This means the most probable fate is misery.
So, self-acceptance builds courage to do it in your way whether others like it or not. This detachment from opinions of others pushes you to do the things which were impossible before – what else is freedom them? Then you understand the value of self-acceptance. You will then have the selfless feeling to let others experience and understand this. This selfless act for others will feed back into your sense of own being. This will support your feeling of self-acceptance. Once you close this feed-back loop, you will see what others are missing. You will help others in the real way. This will create the sense of belonging for you which further creates the real sense of meaning in life.
This is contribution to others in individual psychology.
Where the center of the world is –there is no absolute cause and effect – there is no such thing as the first start and the last end
If you are ‘the center of the world’, you will have no thoughts whatsoever regarding commitment to the community; because everyone else is ‘someone who will do something for me’, and there is no need for you to do things yourself. But you are not the center of the universe and neither am I.
Adler’s individual psychology thus focuses on a feedback loop of three key things:
One – Self-acceptance – you are who you are ‘now and here’, not what made you who you are
Once you accept yourself you give yourself better chances to live an earnest life
Two – Confidence in others – now that you have appreciated how valuable, irreplaceable and incomparable living in ‘now and here’ is, you let people do their own thing because they have their own ‘now and here’. You put confidence in others, you do it not because you want something in return because returning the favor is in their control. This builds the real sense of community, belonging, safe space.
Three – Contribution to others – Once you start believing in people just like the person you are you appreciate what it means to be felt accepted. You try to support this feeling by contributing back to your safe space. You want it to be done by yourself because you now know that contributing back is in your control – your task. This further crystallizes your sense of self-acceptance.
Now that you have appreciated what it means to become truly free, it is normal to reject the false sense of superiority, false sense of being special. Every moment becomes same to you. This does not mean that you become numb to sadness or happiness. It just means that you appreciate that this too shall pass, all I have to live and experience is ‘now’. You lose the idea of a goal to be achieved and accept the real goal, the real target is to become the process.
Life goes on
For a human being, the greatest unhappiness is not being able to like oneself.
Although our existence is bound by birth and death, cause and effect. The reality filled with infinite possibilities does not follow that logic and we fail to notice that difference. Just to make the sense of the infinite possibilities we resort to certain assumptions, prejudices, reasons, past events, future expectations. We never question them with complete honesty because questioning them will bring existential crisis. We all know that our foundations really are not pure or absolute. Once you accept this you will see that it is very easy and important to accept who you are now. This further induces kindness for others. This creates the community. This is called Holism in individual psychology.
You must appreciate how causality brings in determinism in our lives. This determinism is kind of responsible for the lack of freedom in our lives. When we are suffering it is this exact determinism imparted by causality that builds helplessness. One must carry the courage to break out of this determinism. The courage is necessary because we never want to let go the comfort of predictability which determinism offers.
We resort to certain version of our life story when we are completely aware that we can totally change our life story. We are always taking the support of ‘I am like this because this happened to me’. This is how everyone’s story is. There are very few people who have dared to say – ‘I have gone through this for long but not anymore.’ This requires for you to appreciate yourselves first, when you accept who you are you move on to the path of improvement whereas when you are trying to act according to the like of people around you, you are actually proving the point that you don’t like the version that you are that is why you are ready to become the one which people would like and tragedy of this path is that the task of being liked by others is not in your control.
That is why whining about why we didn’t reach there would never help us to reach there or even embark on journey in that direction. We are hesitating to make our own move.
As long as we postpone life, we can never go anywhere, and will only pass our days one after the next in dull monotony, because we think of here and now as just a preparatory period.
Be real, not a hypocrite
People want to like themselves. They want to feel that they have worth. In order to feel that, they want a feeling of contribution that tells them ‘I am of use to someone’. And they seek recognition from others as an easy means for gaining that feeling of contribution.
The main reason Adler’s individual psychology didn’t receive enough attention is because it feels completely self-contradicting and hypocritical on surface level.
You will find these seeming contradictions everywhere in Adler’s ideas. It will say that we are social animals and are defined by society but in next moment it will say that you need to have the courage to be disliked by the people around you.
One time it says that you should not interfere in other people’s tasks and next time it says that you need to have a feeling of contribution for the same people.
One time it will say that you have to sever the relationships where others are not realizing their own tasks and making life difficult for you and on the other hand it will say that you should be unconditionally confident in others endlessly.
One time it will say that you should completely focus on yourselves and then it will say that you are part of a bigger family, bigger universe and you will be happy when you contribute to this bigger community to create a sense of belonging.
If I am being disliked then how the hell would I be happy?!?
If you inspect each of these seemingly contradicting ideas you will find one simple fact – the fact that we are walking living paradoxes and in spite of that we demand sense and logic about who we are.
The sense of self or individual cannot be appreciated well if you never know what it means to be surrounded by people. And there is always some interchange happening between individuals which makes it a society. We often see society as a group which is everything minus ‘I’. We fail to recognize that if I fix myself in certain way the others around me will fix themselves in response to that way and then most of the individuals who constitute the society will fix themselves in certain way. Means even a single person can effectively change the society.
What people actually miss when they come across the ideas put forth by Alfred Adler is the possibility that we can truly reject causality. I would call this unawareness the curse for the humanity. Our sense of ‘being’ inherently originates from some non-absolute attributes, relative references that we have to accept them as the ultimate truth right from our birth to make the sense out of all these infinite possibilities.
We are so entangled in the suffering and happiness waving between the life and death that we ignore that we are born, dead and again reborn every moment. The trick that causality plays in our life is that it tries to preserve the previous step to justify our current stage thereby freezing our present. Whereas what we should do is to just be in now and here which needs courage because there is no guaranteed layout, map to guide you. You have to walk your path all by yourself.
What people fail to notice is that the comfort of predictability is just in this moment but this sense of comfort has no control over future rather it intensifies the pain due to the randomness of the unpredictable future.
The secret to happy life is to be involved in everything and still not be attached to them.
Being social animals, we compare our lives with the lives of the others, we create our baselines and set our targets based on what others have achieved and done in their lives. In our current times when the life expectancy is better than ever, when we have a better cover of social safety than ever, the primitive instinct of survival from natural predators has been replaced by the modern instinct of philosophical- ideological survival which is the ‘preservation of our identity’ – the idea of our own image. The realisation of the philosophical death of our being should come with the awareness that your idea of self, your consciousness was just created by your desires and after this philosophical death you are returning to the fundamental forces of what made them. The endless possibilities for your becoming are opened in this point. This is the true eternal existence – to get broken down into the fundamental blocks of being and be recreated again. Juliet Ivy in her song ‘We’re all eating each other’ beautifully brings the sense of life that is made up of eternal creations and destructions.
Juliet Ivy’s song “We’re all eating each other”
Genuine poetry can communicate before it is understood
– T S Elliot
There exists a special category of songs which sound very jolly, full of life, giving the impression of the light hearted joy, calmness, relaxation everyone desires; on close inspection you end up realizing that the lyrics of that same song is so dark that one would question the mindset in which the song was written and composed. These songs are the songs to which people would dance happily due to its music but the moment lyrics of this songs is opened for discussion you will end up questioning your existence. It feels ironic.
There are many songs to name which fall in this category, I stumbled upon one such song by Juliet Ivy called “We’re all eating each other” from her album playpen.
The song is written by Lucas Sim and Juliet Ivy Ortiz.
playpen album by Juliet Ivy
The great thing about this song is the way its melodies try to befriend you. It’s so simple yet effective and the song’s rhythm is not continuously varying which creates an impression of safe and calm space of familiarity.
What's the point of living without dying for an ego?
So we validate our fantasies to feel like we are special inside
You know we love to lie
I was literally shocked when I started digging into the lyrics. How could one simply state a brutal fact of life as if someone is asked to simply pass salt and pepper on dining table?
For me it creates an impression of life being so simple at its core yet we always choosing the complicated version to justify “our” way of life and “our” ways of truth. Juliet beautifully and very clearly puts this observation in few words of wisdom.
The life we are living, the identity we carry is all we have when everything is taken away from us. This identity is created and molded into a specific shape and size from the life experiences we have. They are mostly subjective and are created from inside. That is exactly why we are completely attached to our identity. This identity has two facets – the identity we truly know ourselves and the identity we project on people around us to show them who we are. Trust me both could be totally different. We are always trying to preserve our identity. This is what Juliet is calling the ego here.
In order to preserve our identity – our ego, we let go of the objective truths and accept certain illusions, fantasies. This is done to create a sense of security otherwise our mind would keep running everywhere in panic. We create some lies, ignore some painful truths to calm our mind down; no wonder they say ignorance is bliss.
The biggest lie is the lie we tell ourselves in the distorted visions we have of ourselves, blocking out some sections, enhancing others. What remains are not the cold facts of life, but how we perceive them. That’s really who we are.
– Kirk Douglas
We like grabbing onto anything to feel like we're important
Not a moment that is shorter than a hiccup or a blink of an eye
You know we're scared of time
Here Juliet shows how the limited span of life brings in the urgency to justify our existence so that we will be satisfied with the feeling that we are special. But we chose to ignore the fact that the ideologies, things that we are clinging to justify our special-ness also have limited lifespan just like the lives we are living. Even though we want to live for hundreds of years, on the grand scale of creation we are not even a blink – not even blink of the blink!
This is more than enough to leave all those false things which we are trying to justify our life, our special-ness with. The moment we let go of the feeling that we are something superior than anything in the world is the moment we lose the fear of not existing. The loss of this fear of not existing would make one eternal. We don’t want to lose the identity we created when we became conscious of our existence. That is why dying without getting any recognition, remembrance is a painful idea for all of us. But that remembrance, those memories will fade away. This should humble everyone.
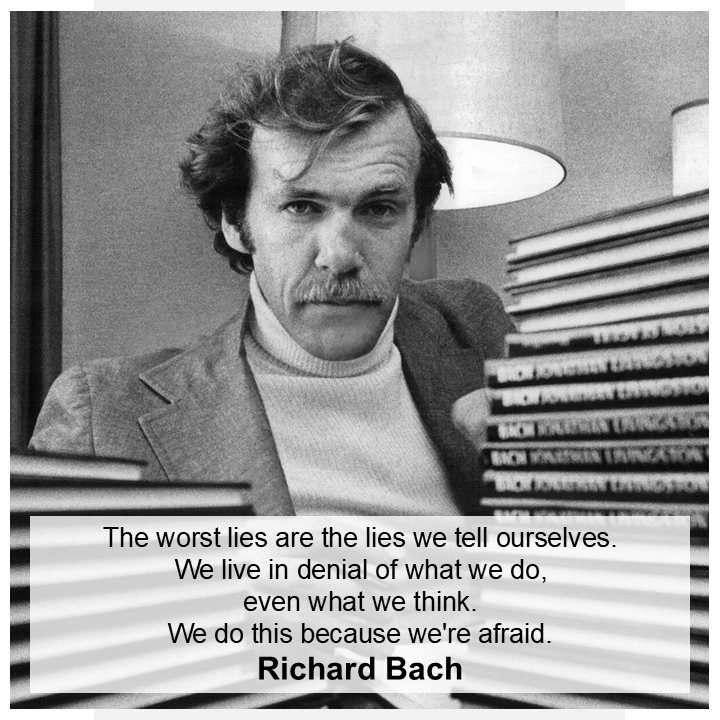
The worst lies are the lies we tell ourselves. We live in denial of what we do, even what we think. We do this because we’re afraid.
We fear we will not find love, and when we find it we fear we’ll lose it. We fear that if we don’t have love, we will be unhappy.
– Richard Bach
But we're all gonna die
Decompose into daffodils and dandelions
The bees will use our flowers for whatever they like
Make the honey that our grand-kids will put inside their morning tea
It's the thing of life
We're all eating each other
The thing of life
Nobody lives forever
The thing of life
The urge to ‘consciously’ exist forever is the only lie we need to let go to become truly eternal, free. We are so attached to our so called “self-created identity” that we consider everything going against is as a potential threat to our existence – the existence which eventually will fade away into nothingness. It is way better to accept the finite-ness of life and be useful to each other rather than carrying that false sense of superiority, higher ego to justify our lies of life.
Juliet puts higher perspective to sooth our confusion of “conscious existence”. We are justifying our egos because we don’t want to die, we don’t want our identity to die, we don’t want our memories to die, we want to be remembered by people even when we are not existing in the world. The urge to preserve our conscious identity thereby our personality becomes the ultimate goal of life.
I am using ‘conscious’ word here to show that we are scared of losing the “I”, “Me” from our life because that is how we experience the life. We create the sense of existence from inside that is why sense of “I” is very important for our existence but if you closely observe the way things exist in the nature it is really difficult to pinpoint what makes that “I” – the “I”. Is it my brain? Or is it my body? is it my property? is it my super-car? is it my villa? is it my designation/ salary? is it my family? What exactly defines us?
You will get the answer once you accept that this thing that you have assigned your identity to – your existence to will not remain forever. When we say it will not remain forever it means that the combinations which created that existence. The existence would crumble down into nothingness.
Now here is an interesting part. We call the crumbles of nothingness “nothing” because they do not immediately affect, improve or help the existence we were trying to hold on to – our identity. We forget that it was the same set of some “nothings” which came together in a specific way to create “something” – this something became our existence.
Juliet beautifully brings in this perspective by saying that we will end up into flowers then into the honey that our future generation will put in their morning tea.
While we are trying to hold onto our special identity which is short lived, which would disappear in a blink we are forgetting the fact that the nothingness from which we were created is more eternal than the identity we are trying to maintain. This nothingness is the truth, its that something which is getting recycled all the time. On the other hand, we are in this constant battle to justify our falsely created, mortal identity.
We should understand that we are actually eternal but this false sense of ‘being’, this false sense of ‘conscious’ steals the real eternal existence.
We don't know how to accept we're just a product of a chance
And less like gods but more like plants
Who can't stop making up reasons we're alive
(We're alive, we're alive, we're alive)
You know we love to deny
(To deny, to deny, to deny)
Juliet is again waging war with our falsely created sense of “special”. We intentionally highlight the facts that justify our superiority and ignore the facts which actually show that we might be the result of few overlapped coincidences. Even if we have not come out of chances and coincidences our existence is not that grand in the whole scheme of existence. On the level of creation, we are as close to plants than the powers which created all of us.
So we paint our face with intellect
Pretending we're not curious
Too busy, super serious
Don't have the time to do what we like
(What we like, what we like, what we like)
Baby look at the sky
In spite of knowing that we are insignificant, knowing that the creation is way bigger than what we are trying to justify ourselves, we are always in the race to prove our superiority. Why does that happen? Why are we always trying to justify our superiority with some lies while we call ourselves the smartest species? Why ‘we’ the smartest ones fail to recognize the objective truths of the world when we know that there is not meaning to chase everything all at once? Why we are always trying to win the race and justify our worth with something?
The reason is that we think our existence is limited, our time of remaining conscious of our being is limited.
We very well know that we will die someday, that is exactly why we try to justify every moment of our conscious existence to something, some idea, some object which we call our job, duty, faith, passion. We don’t want to die with the regret that we have nothing that will remain forever after we die. We are so wound up in justifying the life, memories after our death that we have invested our present into the pursuit of lies which are creating the illusion of our specialty.
Our heads are so engrossed down into the pursuit to create that false identity of worth-ness that we are unable to look up and appreciate the beauty around us, the reality around us.
The urge to lookout for the meaning of life and then assigning that meaning to something so superficial will eventually end into the pain and regret of not enjoying the time we had to its fullest, the moments we had to fullest. We are always trading the real awareness of “present” to gain the illusive comfort of safe “future”. That is how we justify meaning.
The real meaning of life should come with the understanding that whatever it may come next, one will never attach the sense of being to something which amplifies ego. Ego too will perish in the flow of time. The rejection of ego comes when one lets go of their sense of identity being special.
'Cause we're all gonna die
Decompose into daffodils and dandelions
The bees will use our flowers for whatever they like
Make the honey that our grand-kids will put inside their morning tea
It's the thing of life
We're all just eating each other
The thing of life
Nobody lives forever
The thing of life
We're all just eating each other
The thing of life
Nobody lives forever
The thing of life
The rejection of ego will make you free, will show you what your real worth is. Even though you are not special – in the end, you are something of value when you synergize with others. Even though your conscious being is not eternal, the things which made your conscious being are eternal and that awareness should free you from all the urges to justify your identity, your specialty.
You are given a chance to experience the universe in the most sophisticated manner possible which many of the other species might not even have. What more could sooth your existential confusion! Once you realize that you are already made up of eternity, you will let go this mortal identity which you are always trying to preserve with some subjective perspective and lies. This is the real freedom and it requires innocence. Innocence is one of the basic indicators that the person has no ulterior motive to achieve something, it brings in the sense of acting on things without expecting anything in return. Please understand that innocence does not mean that the person should become a fool. Remaining innocent in spite of knowing everything is really hard, that is how you will know that you are not fooling yourselves. This song shows us that innocence.
Conclusion
Juliet Ivy very beautifully brings the sense of life that is made up of eternal creations and destructions. We attach the meaning of our lives, the purpose of our lives to certain things while realizing that they too will perish in the flow of time – this is what would unsettle even the dumbest person. This feeling is also experienced by the highest specimen of humans. In order to come out of this unsettling fear of unjustified – worthless living, we take support from our surrounding. We selectively choose certain aspects that will create an illusion of safety and comfort. Being social animals, we compare our lives with the lives of the others, we create our baselines and set our targets based on what others have achieved and done in their lives.
You know what? Even after achieving such goals which we defined based on our surrounding we are not happy. Even after those material victories, we see that the happiness is short lived. So, we shift our goals to something which is immaterial, something which is spiritual. Something which we think is more eternal than the material things. We make certain ideologies the meaning of our lives. Religion is one of such examples.
René Girard – a French philosopher coined the concept of Mimetic theory where he tries to answer how we decide what to do and why to do. Mimesis roughly means imitation, trying to resemble. When we are stuck with no information or loads of information in either cases, we will be overwhelmed. The best way to come out of such conditions would be to see what others are doing around you. We set our standards based on the baselines of our surroundings. We create lies to justify these baselines and goals we want to achieve. Our ego is thus created to ensure that we maintain the sanity in the times of clueless-ness. It will prioritize survival of body in materialistic races and survival of its own sense of existence its identity in the spiritual races. In the end, both victories will fade away. (That also should not mean that one should not engage in the pursuit of certain victories. It should imply that the non-eternal nature of everything should humble the person.)
The most important point to understand is the ways in which everything great (also everything worse) will be broken down to their most fundamental building blocks. The idea is to not get attached with what you created which got destroyed.
In our current times when the life expectancy is better than ever, when we have a better cover of social safety than ever, the primitive instinct of survival from natural predators has been replaced by the recently created – modern instinct of philosophical – ideological survival which is the ‘preservation of our identity’ – the idea of our own image. (Social media is the booster for such way of life. It is also how the mimesis is happening strongly.) Philosophical death seems more painful than actual death. That is why in certain cases people gather courage to do self-harm. The best way to come out of such mentality is to question the very thing which brought this philosophical death; I know it is difficult to pick on the injury which already is painful to bear. The idea to work in such confusions is to notice one important behavior every one of us maintains when we define our life. We always strive to amplify things which bring happiness and ignore things which bring sadness. We define our life selectively on such choices in spite of knowing that both hold same potential to realize in actual life. This desire to selectively attach to certain aspect brings pain in life.
The moment we accept that there is no end to the cycles of creation and destruction (of both good and bad) we will see that we are nothing but a recycled versions of everything that is there in the existence.
The realization of the actual death of our body should come with the awareness that you are returning to materials which made you.
The realization of the philosophical death of our being should come with the awareness that your idea of self, your consciousness was just created by your desires and after this philosophical death you are returning to the fundamental forces of what made them and thereby what made you. The endless possibilities for your becoming are opened in this point. This is the true eternal existence – to get broken down into the fundamental blocks of being and be recreated again.
Juliet Ivy said all this in one simple sentence “We’re all eating each other.”
The cosmos is within us. We are made of star-stuff. We are a way for the universe to know itself.
The acceptance of our dark side is the only way to start a new journey to the real happiness, fulfillment. Achieving real fulfillment becomes way easier and manageable once we start acknowledging our dark emotions, feelings of sadness and sorrow. Running away from such “low” lying emotions actually intensifies them in the abyss. Actually, such emotions have great contribution in the refinement of our character. Empire of the Sun’s new song called ‘Happy Like You’ talks about the acceptance of our dark side to make our personality whole for creating a newer and better version of ourselves.
Empire of the Sun’s song “Happy Like You”
The best piece of art can be attributed to the multiple perceptions, interpretations it creates in the mind of its subjects despite keeping its physical structure constant.
The beauty of a masterpiece is that people have their own opinion about that piece and nobody is wrong. The mere subjectivity and the possibility to invoke personal feeling in the mind of the observer or the enjoy-er of the art is the power every one of us has naturally. Most of the time very few of us unlock that power in a better sense. Music is one such power.
Recently, I came across newly released album named “Ask that God” by an Australian electronic duo called Empire of the Sun. All the songs on this album are banger and are complete redefinition of what the Empire of the Sun stands for. In my personal opinion, it is a crime to compare all the songs to choose the best one, (but you already know why I am writing this). One song that is looping in my head continuously and has occupied a larger portion of my brain for many days is “Happy like you” (this only shows that the song has conjured me thereby maintaining my previous point of not comparing good songs with each other).
Luke Steele and Nicholas Littlemore of Empire of the Sun
Actually, bringing the poetry into the bastardized territory of prose should be a crime, for it de-beautifies the very reason for it being so wonderful. But, in order for everyone to appreciate the multiple subjective point of views and its connections with the multiple facets of life it is trying to explain, a poetry must undergo its ‘deconstruction’ into prose.
That is the crime I am committing here. If there is any songwriting, poetry, lyrics meaning police anywhere, tell them that I am here waiting for them to tolerate all this prose I have written hereon.
Jokes aside, I am deep diving into the song and its music video.
The song
The song is written by Luke Steele and Nick Littlemore of Empire of the Sun.
You’re revolutionary
You’re like a phantom taking a leap
You’re heart is legendary
Bet you are feeling so high
You have a higher power
Telepathic talk to me
Make me whole again
Whole again whole like I used to be

Happy like you
Happy
The poet is asking the higher power for something that would make him feel complete like he was before. He is praising the power of this higher power so that it can bless him.
The words used by poet like revolutionary, taking leap, legendary heart are used to describe this higher power reflects what he exactly wants from the higher power. He wants to regain a lost part of his personality he was before going through this hardship. He wants the higher power to take the leap to come out of the sorrow, transcend the current state and bring about an “internal” revolution in a way.
Telepathic ability indicates the poet’s trust in the higher power. Poet knows that this higher power is his final resort to all that exists. That is why this power knows everything already and there is nothing required to be expressed formally to get things done.
Ultimately, it is a request to regain that precious part of the poet’s personality, that happiness which defined his whole personality.
Won’t you humanize me
Use all your wisdom
Show me joy in everything
I’ve been clouded by machines
Lost my way deep inside another screen
The rhetorical question posed by the poet is a slight indication of what he lost during his difficult times. He lost the things which made him human. He lost the ability to see the silver linings.
This is the exact spot we must understand that the person lost his personality in depression and mental battles. But why? and how?
Immediate forthcoming lines show what happened. The screens and “machines” indicate the influences of the mechanical world on our daily lives and the added powerful effect of social media which led to a dreadful state of depression.
It’s an irony that when we are ‘liking’ certain things on social media from other people’s lives, a deep-rooted sadness, envy, hatred is getting born out of the one-to-one comparison of lives. Everyone is conscious of these emotions due to social media but the penetration of social media, screens everywhere is so regular and normal that we are subconsciously (now mechanically) ignoring these emotions which take a toll on our minds when we are shocked with something really sorrowful.
All I wanna be is happy happy happy like you
All I wanna be is happy happy happy like you
Once you pass through such horrible emotions of sadness and depression you start appreciating the person you were, how happiness made you the better version of yourself. This happiness made you feel like the greater, higher power itself. That happiness actually made you feel closer to the higher power. The poet urges the higher power to make him who he was before and just in the ways the higher power carries itself.
You’re revolutionary
Telepathic talk to me
You are imaginary
Bet you are feeling so high

Wish is a dream that comes true
The most difficult part of coming out of the depression is that it starts in mind of a person with such an intangible, non-physical thought/ idea and then it starts to affect the real events, objects, people around him/ her. So, even though fixing the reality around such person can help to come out of the depression; uprooting the deeply settled feelings of sadness, grief, sorrow has immense impact in the person’s fight against depression.
That is exactly why the wish to become happy shows that the poet whole-heartedly wants feel happy. The ‘wish’ indicates is readiness from inside to be realize happiness from intangibility to reality thereby highlighting the use of the expression “dreams that come true” here.
Time is a song that forms you
Oh I hope you
The expression of ‘time’ which formed this higher power implies the time which need to given to person to heal when he/ she is in hardships. Give it some time, it will pass too. The poet has understood that over the time even though it will seem difficult but over the time every sadness will fade away. It’s just an ask from poet to the higher power to get the patience, courage for passing through this hard time.
Won’t you humanize me
Use all your wisdom
Show me joy in everything
I’ve been clouded by machines
Lost my way deep inside another screen

All I wanna be is happy happy happy like you
All I wanna be is happy happy happy like you
Ultimately the influence of social media on our lives and the mere algorithmic, mechanical nature of our lifestyle is leading lives of many really happy people to a depressed, sorrowful life. The poet asks the higher power to make such people complete again and happy again just like the supreme power is. It also means that once we become happy and complete, we will become that supreme higher power again.
From a simple explanatory point of view on any poetry/ songwriting, the song gives an impression of the man’s urge to regain his happiness, his identity when he is in the conundrum of depressive emotions and thoughts. The impact of depression is great because the factors causing it are within our hands (or I may say fingers’) reach – the social media and the screens.
I think the songwriters have taken this excuse of the depression from social media to show what an urge to overcome any depression means for any human being; what it means to redefine the personality and also complete the human being in a bigger picture.
The video and its symbolism
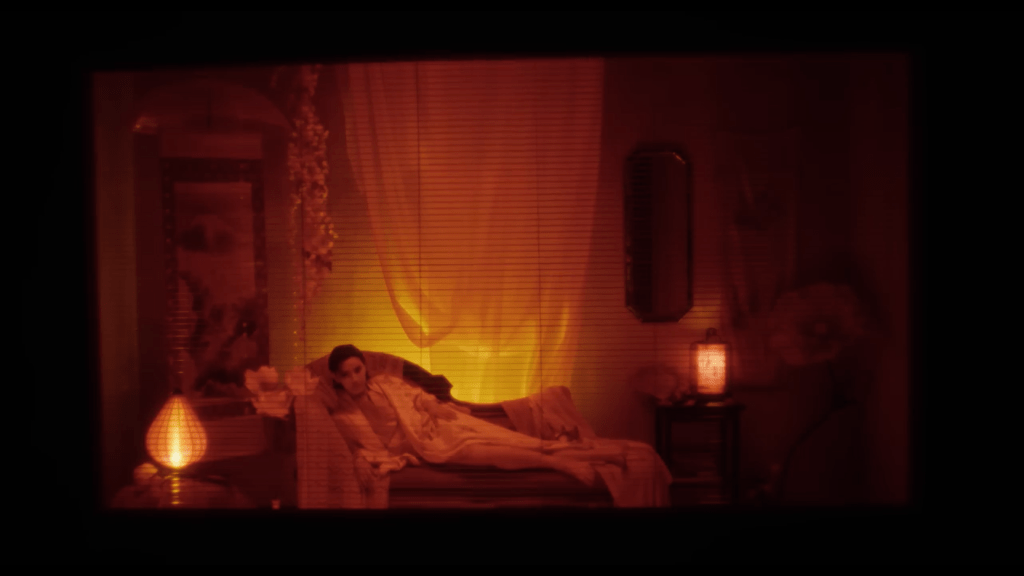
The phone call –
The video starts with a phone call. The girl receives a call on her landline and then the frame shifts to a guy (Luke Steele – Emperor Steele) in a dark with a red hue and dark hat. This is indication of her having a call with her inner self. The low-lit room shown throughout the video is the metaphor of she having discussion with herself and her inner thoughts and emotions. The phone call is proof of she handling her emotions by herself, it is her own conscience calling her.
Frame from Empire of the Sun’s Happy Like You MV
A low-lit room –
Watching reflection in mirror and hand movements on her own body shows she is interacting with herself. It is like a self-talk one has with themselves while figuring out what needs to be done. The low-lit room shows that dark part of our personality which also need acknowledgement. Even though the song calls for the person to be happy, this low-lit room has bigger significance. It is an indication that the real happiness comes with our acknowledgement of our darker side. Darker not in the sense of negativity but more in the sense of left out emotions which also need proper attention.
Frame from Empire of the Sun’s Happy Like You MV
The colors –
Even though the music video looks colorful with some dark theme, the choice of colors used in this video are specific; there are characters, colors to the people shown in the video. Hot, cold, and warm / Red, blue, yellow, greens sometimes – indicate respective emotions and the interaction of the girl with those emotions. It is like she is trying to understand them and accept their presence to find the answers.
Frame from Empire of the Sun’s Happy Like You MV
The window –
In the early part of the song, you will see the girl peeking through the blinds to see what’s behind the glass. It’s literally her peeking into her dark side of the mind.
There is a glass window with blinds between a person and the girl. The person can see her doing all her activities. What girl sees is only her reflection, this absolutely support the symbolism of her having an internal conversation about the overall depressive state of her mind.
Frame from Empire of the Sun’s Happy Like You MV
The sadness, grief –
You will see one person (Nick Littlemore – Lord Littlemore) with the black tears seemingly away from the window in certain snippets of the video, who appears and goes withing few moments. This is that deep rooted feeling of sadness which the girl is trying to acknowledge. One person closer to the glass window observing the girl’s activity is her conscience and the grief is away from the glass lying in the deep abyss of her mind. I say the guy closer to the window is her conscience because it has symbolically shown with multiple colors and hues showing the variety of emotions one carries in themselves.
Frame from Empire of the Sun’s Happy Like You MV
The rain in the end symbolizes new beginning, renewal.
Frame from Empire of the Sun’s Happy Like You MV
The creators of Music video deserve special applause
A deep dive into this ‘prayer’
For me this is not a simple song, it’s a prayer and I have a very strong reason to justify my point. A prayer from a literal, grammatical point of view is a request to higher powers which have better control of the reality than us. We surrender to such higher powers to show that we are humbled and are in a need for help through such prayers.
This song may not have that feel of “conventional” prayers, hymns due to its electronic and not so ‘religious-feeling’ notes, melodies but there is no written rule on the ways to compose a prayer anyways.
On first thought it’s weird, how can a prayer in electronic music make sense spiritually?
I say why not! I would say the composition itself dares the modern listener to appreciate the feeling of awareness of our higher self – hidden inside our own selves. It is like tapping into that unconventional, unexplored hidden, darker part of our own conscience.
The song mainly focuses on visiting and acknowledging the darker parts of our mind, especially when we are in deep sorrow. Abandoning such dark emotions thinking that they are not part of your personality actually intensifies them and when you are feeling weak and defeated – these emotions will easily cover your whole personality.
My point to call this song a pious prayer is that it makes the listener, the singer acknowledge their emotions. Good or bad whatever they are, they together make the personality whole. It also makes them to accept their urge to improve themselves in life. Even though we are asking the higher powers to grant us the powers to become our better version it is actually we – ourselves acknowledging our darker side to improve and build upon them for the better and evolved version of our selves.
The most important act to come out of any negative, depressed feeling is the acceptance of the fact that they are an inseparable part of our personality and only this time they have charge over our personality and we can take control from them anytime we want. You can only cure a person who really want to be cured and live ahead. The feeling to come out of such sorrows has to come from inside and it becomes easy once we accept our darker side of emotions, feelings.
So, the best way to handle any challenging emotional state, any darker emotional state is to first acknowledge them. Acceptance of something wrong or abnormal is the first step to effectively work on handling them. It becomes very difficult to accept that we ourselves are the originator of our emotional responses and its totally normal. We just feel that it is difficult to control our emotions because mostly they are triggered by the external stimuli and that is where the real trick happens. You see, the illusion that our emotions are uncontrollable is created by the assumptions that one need to control his/her surroundings to achieve what they want to become happy. That is why when such person fails, they are immediately drowned into the feelings of sadness. This also does not mean that you should always control your emotions and avoid expressing yourselves.
What I am trying to make point about is that the moment we start segregating our emotions as good and bad we end up in an illusion of happiness instead of the real happiness. Instead of avoiding and dumping, controlling your sad, dark emotions deep down, their acceptance as one more normal part of our personality helps us in a better way to achieve the real happiness.
Being sad justifies the moments of happiness and that also does not mean that you must remain sad – suffer more to be happy in bigger ways. You see, all happinesses in the world are same. Actually, they are not even same, they are subjective – to be precise, there is nothing to compare between any type of happiness. But due to the social media and the screens, we are always trying to compare our happiness with other people’s happiness. That is where the origin of the problem lies.
Looking on the other side of the shore same goes with the sadness; no two sadness must be compared. Acknowledgement itself is more than enough.
Working on sadness is like hugging an annoying crying kid; just a tight hug without any intent. The kid will stop crying.
Once we have accepted all our emotions as a natural part of our personality then only can we have the chance to recreate our personality. This requires humbleness and in most cases when people are thrashed with the reality and the sadness, when they are helpless the final resort is the spirituality where the help from almighty is requested. The moment you attribute this power to any object especially human-like object the religion starts taking shape (that would be topic or another discussion!) But without diverting the topic, only when we are humbled then we seek help from others. Prayer allows you to do that without any feeling of shame. That is exactly why I feel this song is a prayer. It allows you to accept your darkness, understand it and asks you to use it to create new happiness.
I will stick to Kierkegaard on this, we have to understand that when we are praying to the higher powers to handle our lives in a better way, we are actually asking the forces lying inside our own selves which hold the capacity to create the better version of ourselves.
We are capable of creating better times for ourselves on a condition that we acknowledge every part of who we are. It is just our mechanical nature to categorize certain things as good or bad sad and happy which takes charge of our whole personality. You will appreciate this more once you closely observe the stories behind the creation of all types of the masterpiece humanity has ever seen. All those great things had that unconventional, hidden dark side which triggered the creation of something totally new and radical.
So, in order to become truly happy, one must accept their dark sides that is where the potential to have completely new beginnings lies.
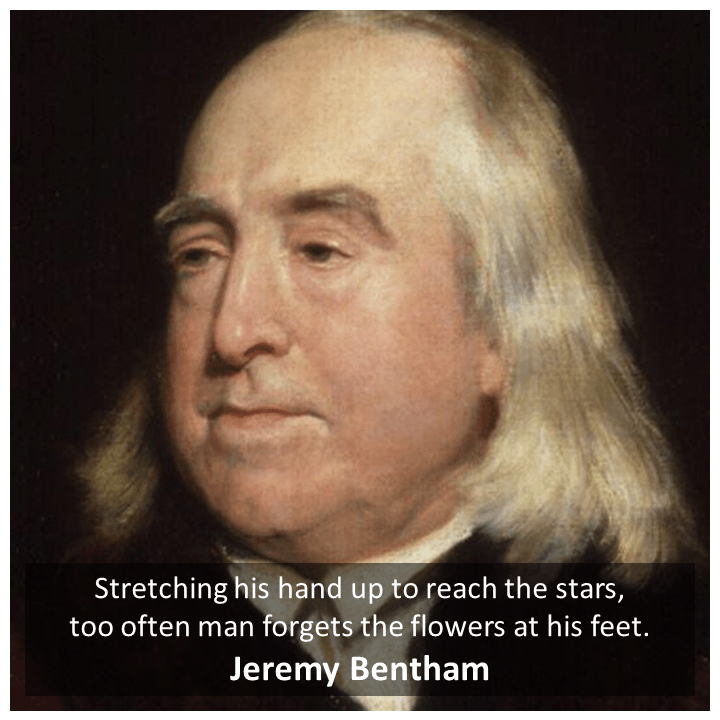
Why doesn’t Batman kill all his villains once for all? Why the sentence passed by judicial systems in certain heinous and extraordinary crimes feel unjust for the pain victim went through? How one can tell that given person was right or wrong when he/she had no intent of doing it? Can you just look at the end consequences of the actions and decide right or wrong for such scenes? Jeremy Bentham’s philosophy of Utilitarianism tried to answer some of these questions but it revealed certain flaws in our ways of judgement. Even though hedonism and utilitarian philosophy create an objective model of morality, they fail to address the subjective and human aspect of any moral discussion. It reveals that the purpose of living is not mere happiness but self-improvement thereby mutual and overall improvement.
How to judge morality and its impact on human life?
The Moral Dilemma
A healthy sense of good and bad makes a society livable. There are some special, rare events that happen in the society we live which challenge our idea of what is good and what is bad. There are uncountable offenses and also in varying types which create problem of who should actually be punished and what should be the punishment.
An eye for an eye will make the whole world blind.
Mahatma Gandhi
If this is really the case, the law and order should punish the victim in such a way that it prohibits the future perpetrators to not do such crimes again. But again, as this above mentioned quote goes if the punishment given for the crime is equally dangerous then what exactly are we trying to establish through such punishment?
It’s like that scenario where murdering a murderer creates a new murderer so the net number of murderers in the society remain the same. An Italian philosopher called Cesare Bonesana di Beccaria had given a thought on this. In his book ‘Of Crimes and Punishments’ he discusses that if the punishments grow on crueler and crueler the net mindset of people also grows crueler. It’s like how water levels itself irrespective of the depths. The baseline of what is right and wrong furthermore what is more wrong and what is more right shifts up. Crueler and crueler crimes reduce the sensibility of people of that society. This could be one reason why people always argue that the judicial system does not provide equivalent punishment as a justice to the victims of certain heinous, exceptional cases of crimes. (Although there are many other factors to make such decisions.)
“In proportion as punishments become crueler, the minds of men, as a fluid rises to the same height with that which surrounds it, grow hardened and insensible; and the force of the passions still continuing, in the space of a hundred years the wheel terrifies no more than formerly the prison. That a punishment may produce the effect required, it is sufficient that the evil it occasions should exceed the good expected from the crime, including in the calculation the certainty of the punishment, and the privation of the expected advantage. All severity beyond this is superfluous, and therefore tyrannical.”
Cesare Beccaria, Of the Mildness of Punishments from ‘Of Crimes and Punishments’
In similar spirit, the relationship between Batman and Joker can be understood. Joker never cares about killing people he will try to stretch the limits of batman in every possible sense where innocent lives are at stake. Batman has one solution to stop all this – to kill the Joker. But with a high moral ground Batman would never kill Joker. What is the motivation behind such character design of Batman. Batman knows that killing Joker would solve the problem once for all. Believe me, this is not just a fictional comic book scenario. The reality that we live in has uncountable such scenarios where exactly same decision dilemmas occur.
The famous trolley problem also points to somewhat similar moral dilemma. Where should the trolley be directed if one track has single person and another has 5 people tied to the track? Nobody wants blood on their hands.
But the same trolley problem becomes interesting if you start adding additional attributes to the people who are on track.
What if the single person tied to the track is a scientist with the cure for cancer and the track with five people are criminals? Then definitely you would kill the five criminals instead of the single scientist.
Did you notice what change made us to decide faster? The moment we understood the consequences of our actions we had the clarity of what is right and what is wrong. Our moral compass pointed to North the moment we foresaw the consequences of our actions.
The foundation of some of the principles of morality are based on similar ideas. Utilitarianism and Jeremy Bentham’s an English Philosophers ideas have contributed to the ideas of morality for humanity, especially when we are talking about the human society as a whole. The ideas put by Jeremy Bentham also faced severe criticism, we will see those in detail too. But the key intention of my exploration is to understand how we create the meaning of Morality and how subjectivity, objectivity totally change the way we perceive morality. In the end we may reach to rock bottom questioning the morality itself to be nonexistent – and if morality is non-existent then what separates human beings from animals? (I hope to enter in this territory with some optimism, I don’t know where will it end.)
Utilitarianism
As I already explained in the trolley problem that by adding one simple, short part of information shifted our moral compass in (supposedly) proper direction. What did this information add in the dilemma to make it solvable?
The answer is the foresight of consequence. Once you saw the consequence it leads to you got the hold of what is right and what is wrong. You decided one side to be right and other one to be wrong. This foresight of consequence helped you to weigh the ‘right’-ness of your decision.
Utilitarianism is based on the measurement of morals based on the consequences of the actions you take. What is the other side of taking actions? It is ‘the intent’. This is where the fun game begins.
Many philosophers are always fighting over morals based on the intent of the person and the consequences of the actions they take. For example, thinking of murder (pardon my thinking) makes me less of convict than really murdering someone. My thinking has not led to the loss of the person I hate. Utilitarianism thus calls out for the construct of morality based on the actual actions and their consequences; it’s like saying ‘what a man is more about what he does instead of what he thinks’.
Hedonism, Utilitarianism and Jeremy Bentham
Happiness is a very pretty thing to feel, but very dry to talk about.
Jeremy Bentham
Jeremy Bentham an English philosopher contributed to the utilitarian ideas of morality. He was not well appreciated in his home country due to the misalignment of his ideas of socio-political reforms with the British sovereignty of those times. The French translation of his works on law, governance gave him popularity in Frenchmen. Bentham was one of the people who pushed the political reforms during French revolution.
While reading Joseph Priestly’s Essay on the First Principles of Government, Bentham came across the idea of “greatest happiness for the greatest number” which motivated him to expand the ideas of utilitarianism.
Priestly brought the idea of “Laissez-faire” (‘allow to do’ in French)- a policy of minimum governmental interference in the economic affairs of individuals and society. Joseph Priestly developed his ideas of politics, economics and government based on the ideas created by Adam Smith (Author of the Wealth of Nations – the holy grail of classical Economics).
The Greek philosopher called Epicurus was the supporter, creator of hedonism. Hedonism defines ethics to pleasure or pain. According to hedonism that which gives pleasure is morally good and that which give pain is morally wrong. The idea behind hedonism is the aversion of pain to live an undisturbed life because anyways this all won’t make sense once you are dead. According to Epicurus – fear of death, retribution is pushing people to collect more wealth, more power thereby causing more painful life. The collection of wealth, power is done thinking that they can avert the death but that is not the reality. So, worrying about the death sucks out the pleasure of living the life which itself is equivalent of death.
Non fui, fui, non-sum, non-curo (“I was not; I was; I am not; I do not care”)
Epicurus
So, epicurean hedonistic morality tries to maximize the pleasure. The other end of this idea is that if everyone tries to maximize their own pleasure (egoistic hedonism) wouldn’t it disturb others?
If I want to listen to a song on loud speaker while bothering my neighbors, what is the moral standpoint here?
The answer is the overall good of the system. So, if you neighbor also wants to listen music loud and overall loud music is good for the group then we are morally right to play loud music. (Just pray that the group has same music interests!)
So, Jeremy Bentham is known to rejuvenate this ancient philosophy of egoistic hedonism through his philosophy of utilitarianism.
The basic idea behind Utilitarianism is to maximize the utility of anything, value of anything. The utility can be increased by doing what is right which can be done by doing what gives more pleasure or by avoiding those things which increase or give pain.
Utility is a property which tends
To produce benefit, advantage, pleasure, good or happiness
To prevent happening of mischief, pain, evil or happiness
So, the right action is the one that produces and/ or maximizes overall happiness. Please understand that the word “overall” is important for Jeremy Bentham’s philosophy of Utilitarianism. Because from selfish point of views, what is pleasurable for one may not be pleasurable for others. (This is also where the certain philosophical problems of Utilitarianism are hiding, save this point for later.)
To solve this bottleneck of clarity, there are two types of pleasure in human life – one is happiness from senses, physical experiences and one is from intellect. The intellectual happiness is higher than the pleasure from senses. So, on personal moral dilemmas these two attributes can solve the problem.
All good on personal level but what about the moral decisions for the group, for society? Here, Bentham solved the moral dilemma by using the idea of “greater good for all”. When we don’t agree on what makes us happy together, making sacrifices in your happiness to make others happy is the solution. (Keep this idea parked in your mind.)
“Nature has placed mankind under the governance of two sovereign masters – pain and pleasure. They govern us in all we do, all we say and all we think.”
Jeremy Bentham
Felicific Calculus – Measuring happiness
Jeremy Bentham is known as the Issac Newton of the Morality for developing the felicific calculus/ hedonistic calculus. Bentham pointed out the key factors which affect the net happiness and using this factors’ effect as a whole, one can quantify the happiness.
Following are the factors which affect the happiness:
Intensity – how strong is the pleasure from the given action?
Duration – how long does the happiness remain from given action?
Certainty – what is the likelihood of given pleasure to occur?
Propinquity – how soon/ immediate is the occurrence of the pleasure?
Fecundity – what is the possibility that this pleasure will also lead to the newer pleasure(s)?
Purity – what is the change that this pleasure will not bring some opposite sensation?
Extent – how many people are affected?
If one considers these factors and the principle to maximize the communal happiness, most of the social moral dilemmas can be effectively solved.
So, according to this felicific calculus,
Batman should kill the Joker for the greater good of the Gotham
The trolley should go over the group/ person which creates more pain for the society
Baby Hitler should be killed once we get the chance to travel back in time
You must appreciate the clarity which the felicific calculus brings. This clarity is very important for the policymakers, politicians while deciding the fate of the group, state, nation as a whole.
Now a simple question –
If batman keeps on killing the villains, won’t he become the greatest killer of them all? What would differentiate Batman from other villains?
What would happen if you were given false information about the nature of the people tied on track while riding that trolley? Could your wrong decision be undone? If it was the wrong decision then now ‘you’ are morally wrong, with the blood of the innocents.
You would kill baby Hitler only because you have vision that this baby will grow up to be the mass murderer tyrant. The mass murder hasn’t happened yet. So, now you are the killer of a ‘now’ innocent baby.
Maintaining same emotion, now you would appreciate why even for a strong judicial system giving capital punishment for rapists, terrorists is difficult morally. You would solve the problem for now because the act has been already done, the consequences have already happened (which is why moral judgement is effective as it relies on the consequences). Killing the perpetrators or punishing them with equal pain would definitely bring peace of mind using the principles of morality but that also degrades the morality of innocents who fell down from that morality. It is not matter of what one deserves because what bad happened to them, it is about how less human you will become once you perform that act of punishment.
Recall the quote of Beccaria in the early part of my discussion.
Killing joker will create fear among other villains but it also creates chance for the creation of even dangerous villain in future.
Killing baby Hitler doesn’t guarantee prevention of World War and mass murders, as our personalities are the result of our surroundings – another Hitler-like person would have emerged in such given circumstances. (I honestly don’t know if he/she would be worse or less harsh than the original one but you get the point – conditions anyways would have created another cruel person.)
Jumping out of the trolley seems the best way to run away from the pain of murder of other unknown people (joking). The trolley dilemma remains dilemma.
Also, the felicific calculus allows pain for small groups for the betterment/ pleasure of the bigger society. For example, according to this utilitarian idea killing few healthy convicted prisoners to save lives of many innocent people by harvesting the prisoners’ organ is justified. It is for the good in the end.
You see where this goes?
See the level to which any human or a group could go if they start justifying their moral rightness using these ideas. Using these principles any big group can overpower the minorities in morally right way. It is just a matter of time that the felicific calculus principles would get exploited for other “immoral” gains.
That is exactly why many people criticized the felicific calculus saying that a pig laying in the mud for his whole life would be happiest than a human being (Socrates to be specific) if Bentham’s calculus is used to decide morality.
In a crude way, there are two type of Utilitarianism which help to solve the problem to certain extent, but it is not a complete solution:
Act Utilitarianism – to act for the greater good of all
Rule Utilitarianism – to set rules in such way that no one inherently gets the pain or everyone is happy because actions and their consequences are bound by certain set rules in first place now
Happiness is not the ‘only’ and the ultimate goal – the limitations of Jeremy Bentham’s Utilitarian Philosophy
What people were not ‘happy’ with Jeremy Bentham’s felicific calculus was that it made humans more like machines and very objective. People don’t always want happiness for their or the group’s greater good. Exercising daily, reducing fat-sugar maybe painful but that guarantees healthy, illness free long life. Doing drugs isolates the person from pain but it impacts the long-term physical and mental health of the person. Hardships and pain make people to reach their difficult goals which is what is the real and ultimate happiness for them.
Happiness is not always the goal of life, if one is completely tangled in the pleasures of life and if everyone is having same mentality then in the end no one will be happy, because as a group we all would never agree on what makes us happy; different environments in which we grew, our personal experiences, our upbringing, our motivations prevent us from creating a common definition of happiness.
The subjective factor of pleasure or pain is not present in Bentham’s philosophy of Utilitarianism. Building further upon that, the victim who has suffered from the morally wrong action will only be satisfied when he/she gets justice, not when they are made happier than their perpetrators. (This justice must again not be mechanical and objective like the felicific calculus.)
One more flaw of the Bentham’s utilitarianism is the imbalance between personal scenarios and the communal scenarios. In most cases, it demands personal sacrifice irrespective of their subjective morality for the betterment of the group. (that is exactly how many past cruel dictators have justified their moral correctness on their acts against the minorities.)
A British philosopher, Bernard Williams presented a thought experiment to highlight such flaw of the Utilitarianism.
In this thought experiment:
A botanist on his South American expedition is ordered by the cruel regime soldiers to kill one of the Indian tribe people. If the botanist fails to kill one Indian the soldiers would execute all of the tribe members.
So, if we implement utilitarian principles, then the botanist should kill one Indian to save the remaining all. That is morally right.
But on the other hand, one must also understand that the botanist has nothing to do with the cruel regime and even with the indigenous tribe members. He is under no moral obligation to do anything. The consequences are in such a way that whatever he will do he will be called morally wrong. Which in the end is wrong.
The utilitarian philosophy neglects this subjectivity and consequentialism while we are deciding morality of anything.
Maybe that is also why even when we have all the rules in place, penal code in place for all types of offenses, similar crimes – we have a judge – a subjective, consequential observer to grant the final justice.
You must understand that the discussion does not want to pose Utilitarianism as completely wrong idea. The intent of this discussion is to understand how to de-clutter a complex moral scenario and how to inject subjectivity in it so that the correct person will get the justice in the end. As we are human beings and not machines, every day brings new subjective scenarios with new subjective moral dilemmas. Direct implementation of utilitarianism may bring in the transparency in the moral puzzle but it is at the expense of oversimplification and loss of personal subjectivity, consequential personal point of view and also freedom of person to exist.
The ways in which Utilitarianism brings immediate clarity by elimination of some important subjective aspects is dangerous and limits the judgement of real morality. Friedrich Nietzsche had warned new philosophers in his book beyond good and evil about the philosophies which create such “immediate certainties” like Utilitarian philosophy creates-
“The belief in “immediate certainties” is a moral naivete which does honor to us philosophers; but – we have now to cease being “merely moral” men!”
Friedrich Nietzsche
Conclusion – If not happiness then what is the goal of being human?
Jeremy Bentham’s philosophy of Utilitarianism and the felicific calculus can help to decide the morality of what is good for all but it ignores the presence and worth of personal integrity, the well being of the minorities, subjectivity of the person in given consequences. It by default eliminates the possibility of humans remaining human beings instead it attributes them as the machine maximizing a targeted outcome (which is pleasure here).
So, the question remains – If we are not meant to maximize pleasure during our tenure in life because in the end after death there will not be anything to experience or gain happiness – if our existence and final purpose does not align with being happy then what exactly is the purpose of being a human being?
Based on my understanding on what many great people have commented about the purpose of life, I found that most of them point to remaining the human being you always were. I am not saying that the personality should remain the same, rather it should change and keep on upgrading itself till the end but the core should remain same or it should not degrade at least.
Some wrong events, injustice, oppression, cruelty will make you suffer, but that should also not vilify your human spirit. Once we let go the pursuit of happiness and chase the goal of being a better human being (or at least remain the human being you are) we can fulfill the purpose of our lives and also make other people’s lives better.
Once you will let go of such utilitarian, mechanistic setups of morality you will realize that people don’t need gods, religions, governments, judicial systems to keep in the check of right and wrong. Our inner compass is more than enough to take care of what makes us human beings, this inner compass is not about what is right and wrong, for me it is about what better version of yourself you would become if you act in that certain way. It takes care of what you are thinking and what would be the consequences of actions thereby resolving the dilemma of morality which got separated on the basis of either intent or the consequences.
I am highlighting the importance of inner personal human compass because the rules designed to keep morality in check would always need revision and the utilitarian philosophy would wait for the consequences to happen to decide the morality. The goal of human struggle to improve their current version to a better one does not need either of the metrics to decide the morality.
Imagine what the world would become if everyone started appreciating this inner human compass!
(For now, we can only imagine, but I am optimistic on this.)
P.S. –
Even though the Utilitarian philosophy had many flaws, Jeremy Bentham contributed largely to bring in new political reforms, improve governance, establish penal codes in judicial systems, define sovereignty, reduce the influence of religious institutions on the lives of people and governments. His works were strategically maligned by some lobbies to lessen the impact of his other notable works. He was the proponent of liberty and freedom from religious influences on lives of people. The pushed for the establishment of a secular educational institute in London – now famously known as University College London. Jeremy Betham’s fully clothed wax statue containing his original skeleton remains in the entrance hall of the University main building upon his request.
Anxiety serves to prepare a person for threats. Anxiety just like pain is one uncomfortable but effective way to cope up with the adversities in life, that’s how we build strength, resistance and deeper understanding of the surrounding for better and more precisely predictable future.
The remarkable concepts like smoke detector principal and optimal threshold in signal detection theory developed by modern psychologists/ psychiatrists help us to draw a line between a healthy anxiety (adaptive function) and unhealthy anxiety (pathology) and show ways to handle/treat them effectively.
Anxiety’s like a rocking chair. It gives you something to do, but it doesn’t get you very far
Jodi Picoult
Survival, Fear, and Anxiety
Every living thing if not have any goal in their lifetime would at least have sole goal of existing, surviving. Nobody wants to die and all of us always yearn to live forever but we know our limitations and hence are always on the quest of justifying the finite existence granted to us. Even if we are certain of the end closing in, our instincts are evolved in such way that many of the times, we bear the ability to cheat death. Humans have further extended cheating the death using science and technology. Technology augmented our lives, reduced the risks of death, created a safe environment to grow, increased our chances of survival.
The fear of death and uncertainty of future is the key driver in our improved survival instincts and excessive use of technology to achieve it. We plan for things in advance, create backup plans if something would go wrong, have risk assessments before the execution, understand and decide according to the cost benefit analysis. That is what makes us humans and also separates from other species (although rest of the surviving species are also smart in their own ways to increase their chances of survival like viruses – but hopefully humans have other ways to overcome them)
So, fear in a way triggers the actions to ensure survival. Anxiety – a sophisticated form of fear which prepares us in advance even before the fear causing scenario is supposed to happen. Simply put anxiety is an anticipatory type of fear to increase the chances of survival.
I am talking about fear and anxiety because they are bugging my mind for many days. Recently I watched Inside Out 2 movie and the it really delivers. The narrative has successfully presented how all emotions play a vital role in creating our personality in whole. Anxiety was new and important emotion presented in this movie. Every moment where anxiety came in focus it was fully relatable to me. Once I was done crying in the end the anxiety never left me (figuratively!), I felt a strong urge to understand the anxiety on deeper levels and what the domain experts have to say about anxiety.
The discussion heron is not a movie review rather I have made some attempt to summarize what the real-world scientists have to say about anxiety. I won’t be giving you the tricks, counseling and recommending any medicines to cure anxiety disorders. (Trained professional, experts are the best people to do that – “I AM NO EXPERT”)
My focus of the discussion is to question why anxiety exists in first place when we have an emotion called fear, another question is how to interpret the anxious emotions and what leads to anxiety disorder, where does the root of anxiety lie and is anxiety a bad or negative emotion? If it is so then why? and if not – then why?
While posing such questions and researching articles I came across some beautiful ideas, experiments and theories established by professionals in the field. I will throw light on these ideas in the coming discussion.
The fear is real! – is it? – Defining anxiety
As I already mentioned that fear of death, the unknown and urge to live long are always fighting with each other. Humans rather every species existing today in nature mastered this battle to some extent and have ridden on chariots of evolution to augment – change themselves to adapt with the surroundings and improve the chances of survival.
A deer completely aware of its surrounding, grazing in the open grass fields can distinguish the rusting of leaves due to winds and rustling due to sudden movements of an apex predator like tiger. When the exams are on top of tomorrow, we are ready to sacrifice the night sleep to crack them (engineers would resonate more with this!) We know that the pain of failing, fear of failing is worse than painfully covering syllabus overnight! The fear is there and the anticipatory response is also there, only the level of sophistication is different.
Why I say sophistication? It is because due to the advancements in our lifestyles humans are rarely exposed to the real life-threatening scenarios like animal do (still today). Our fears are now more anticipatory. I would say most of our fears are now classified as anxiety.
Wikipedia goes like this for anxiety –
“Anxiety is an emotion which is characterized by an unpleasant state of inner turmoil and includes feelings of dread over anticipated events.”
So, the key differentiating aspect between fear and anxiety is the anticipation. Anxiety is a prospective emotion and a forward-looking emotion. Whereas fear is the emotional response to current threat. Fear makes us act immediately; anxiety keeps us ready for future threats. Fear will immediately decide fight or flight whereas anxiety will create plans, strategies for both and also calculate which one is more probable. (now you can appreciate why anxiety is more intense in over-thinkers, the analysis paralysis is one mild example of this.)
Anxiety is also an emotion important from evolutionary perspective as it has helped the current existing species to remain existent. The ability to anticipate future and preparing for it in advance gives competitive edge in survival.
Why Is Anxiety Good?
While reading about anxiety I came across a very good paper by Dr. Randolph M. Nesse.
Dr. Randolph M. Nesse, UoM
Randolph M. Nesse is a Professor Emeritus of Psychiatry and Psychology in University of Michigan. The ideas and theory he created to understand and identify anxiety and its intensity are very important and interesting.
Dr. Ness developed the smoke detector principle to control and quantify the medication used to fight with anxiety disorder. (He poses very simple but important question the opening of the paper that “Is he medicating his patients too much? is he harming them?”) The fundamental doubt Dr. Ness had was if the anxiety is evolved during evolution to improve our chances of survival, then why are we forced to reduce its symptoms and effects? Why are we using medications, therapies to reduce these symptoms, effects of anxiety. What if the patient is too anxious for given thing and that thing is too real to happen but the doctor dumbed that emotion down? (Dr. Ness calls it down-regulating the mechanisms causing anxiety)
The core of his thinking is that if we keep on “down-regulating” our anxiety which is an evolutionary gift to us, we might never be able to gauge the future in better way and prepare for it in advance to improve our chances of survival. (this is an exaggeration of the scenario but it proves a point)
This calls for the quantification of anxiety. Which Dr. Ness did through the smoke detector principle.
The Smoke Detector Principle – How Much Anxiety Is Too Much?
Dr. Ness in another paper talks about the mechanism which is a feed-back system between the animal and its surroundings, which selects the emotional response to improve the chances of survival. The emotions we have today are the result of such evolution to maintain “homeostasis” – the balance among our bodily system to survive and function properly.
According to his ideas, anxiety works like a smoke detector.
The anxiety response is always trying to maximize the chances of survival and escape from a life-threatening situation. When we set a smoke detector it will go off even when the fire is not that extreme or if there is just some smoke which can be a controllable one. The smoke detector is designed to never miss a single fire causing situation. This ensures complete confidence in smoke detector that it will save people from every life taking fire scenario. But, it’s the same mechanism of smoke detector which forces people to evacuate frequently even when the fire or smoke where controllable or life threatening.
The frequent emergency evacuation even when it is not required is the same problem with the extreme intensity cases of anxiety. Always having armor ready for combat may sometimes make the soldier to lose the agility.
The patients with anxiety disorder have lowered sense of real threat. Their system triggers too many false alarms.
Dr. Ness established various techniques to quantify the levels of anxiety. The responses from anxiety include increased heart rate, rise in certain bodily chemicals – stress hormone secretion which can be easily measured as signals using instruments. Thus, the smoke detector principal paved a way to quantify the anxiety and understand what triggers the anxiety disorders in patients. It helps to understand how and why a level of anxiety is healthy in normal person and what level of anxiety is unhealthy and needs drug administration, therapy, how it can be administered by altering the setting within and around the person.
The core reasons why we need not to be intensely anxious about common life threats are as follows as Dr. Ness explains in his papers:
Regulatory mechanisms have tendency to make errors and be extra defensive about situations
We do not need to always be extra defensive to avoid given threat. (A machine gun in a bulletproof enclosure is not required to kill a mosquito.)
Our body and surroundings have multiple layers of defense for almost all common threats. We are evolved and have survived in that way.
Our environment is much safer than it was at the time we evolved
Types of Anxiety Disorders
Now that we have understood what is the nature of anxiety and what is its mechanism. Here are some important anxiety disorders to outline. Huge amount of information is available in literature, internet websites on these:
Generalized anxiety disorder (GAD) – too much worrying about ordinary things, problems like money, work, health, relations, family, and anything possible or imaginable, it may not exist in reality.
Hypochondriasis – People suffering from this often worry about the health condition when nothing is wrong with their body. The word comes from feeling of stomach pain the person experiences even when everything is alright.
Specific phobia – fear of anything but specific without any reason. It’s the fear for certain thing even when it does not pose threat.
Social anxiety disorder (SAD) – In this scenario people intensely fear the public situations, humiliations, embarrassments, criticisms.
Separation anxiety disorder (SepAD) – People in this case intensely fear the loss of person or a place
Agoraphobia – it is fear of being in situation where there is no exit door, or escape strategy. Fear of using public transportation, being in large crowds are some examples.
Panic disorder – these are outburst of all the collective or intensive fears, they come quickly and last for short time.
Selective mutism (SM) – in this case the person is extremely fearful of initiating a conversation, does not speak to specific people or in specific situations or conditions even when they are forced to talk by humiliation or mocking.
Post traumatic syndrome disorder (PTSD) and Obsessive-compulsive disorder (OCD) were once classified under anxiety disorders (now not under anxiety disorder in DSM – Diagnostic and Statistical Manual of mental disorders)
Signal Detection Theory For Interpreting ‘Anxiety Like Responses’
One good paper in the Canadian Journal of Psychiatry by Bateson et al. shows how the smoke detector principal can be used to decide the boundaries of different levels of “anxiety like-responses”. This paper talks about signal detection theory and optimal threshold. The beauty of this paper for me is the mathematical model it establishes to explain psychological events. A single formula will help you understand the difference between normal anxiety and anxiety disorder.
With the smoke detector principal, we can now appreciate that not every common threat needs full armored protection. The signal detection theory in this paper shows where a person draws line when they overestimate or underestimate anxiety.
It talks about “optimal threshold” to show a threat response in given situation. Optimal threshold is a mathematical parameter which is function of probability of the occurrence real event and vulnerability of the individual.
The signal detection theory says that the superposition of response signals for given background noise and response signal from real threat give us the quantified judgement of how intensely the anxiety is triggered compared to the practicality of the threat – this quantified judgement is called optimal threshold (λ). Lower the threshold more intensely the anxiety will be triggered for given disturbance – background noise.
Figure 1 : Signal detection problem, how the optimal threshold can be calculated. (Credit: Anxiety: An Evolutionary Approach, 2011, Bateson et al., Canadian Journal of Psychiatry)
Equation 1: optimum threshold (Credit: Anxiety: An Evolutionary Approach, 2011, Bateson et al.,Canadian Journal of Psychiatry)
Here,
λ = optimal threshold
pnt= probability that there is no threat
pt= probability that there is real threat
wfa= cost of false alarm
wmiss = cost of a miss
Once this equation comes in focus the discussion becomes interesting. The ratio of pnt to pt mathematically quantifies how practical the threat is. The ratio of wfa to wmiss mathematically quantifies what will be the cost if the anxiety trigger is accepted or rejected – will the subject live or die. This ratio shows how we trigger anxiety response. If the cost of responding is nothing for even a simple threat scenario, we will choose to trigger that response, same would happen if the cost of losing is ultimately the loss of life, we would trigger any possible anxiety response to avoid it. The authors call this ratio as individual’s vulnerability.
The ratio (pnt/pt) can be seen like this. If the surrounding really is hostile and consists of events which cause many life altering events than the safety ensuring events then the pt (probability of threat) will be way higher than pnt (probability of no threat and safer environment). In war situation where multiple bombings, gun firings are happening around you the probability of threat happening (pt) is way high than it not happening (pnt). The optimal threshold will drop immediately and anxiety triggered will be very high.
The ratio (wfa / wmiss) can be seen like this. If the person is way stronger to handle given threat, then the person will need no effort, investment or cost to trigger any reaction alarm to even a false threat. Consider the example where you are about to be bit by mosquito, you know the efforts to slap many times until the mosquito dies are not worthless, you will try many times to kill it even when you know it will swiftly escape, you are less vulnerable in this scenario. But now when you are about to be killed by John Wick (!?) you know for sure that even a pencil will do the job for him, any environment is hostile for you, you are vulnerable here, the value of losing life (wmiss)is way high than the cost of attempts to save it (wfa). Your optimal threshold will immediately drop down thus triggering intense anxiety.
Once you generate enough data for such optimal frequencies you can easily distinguish the healthy anxiety responses and anxiety disorders. I loved how these two factors (probability of threat and vulnerability of an individual) can predict the levels of anxiety in a person. This equation explains and can also quantify why pregnant women have heightened awareness of their surroundings, why people get insomniac after constant mental stress, why restless people are always in the mode of action and fight, why reclusive people hesitate to visit foreign, unknown places.
Your Surroundings and Mindset Matter!
Figure 2 : Three levels of vulnerability, here optimal threshold and probability of event can be correlated for difference in the anxiety responses (Credit: Anxiety: An Evolutionary Approach, 2011, Bateson et al., Canadian Journal of Psychiatry)
It is really interesting what the authors have achieved and established in this research. They compared three different levels of vulnerability and explained them using given plot. The thing to highlight here for anxiety disorders is that they emerge from the environments which always keep on presenting high probabilistic practically threatening scenarios. The anxiety disorders also emerge when the individual feels more vulnerable.
Higher the vulnerability lower will be the optimal threshold and intense will be the anxiety response.
As shown in research, in the uncertain times of Covid-19 people who were locked in their home had no disorders, were not exposed to the virus also felt anxious and faced some anxiety disorders because of the environment they were in.
If the person feels less vulnerable and stronger then even for given strong life-threatening events the optimal threshold will be higher thus the anxiety triggered will be lower.
Are you noticing where this is going?
This is a mathematical model which shows how a healthy, supportive, and safe environment and also a strong mindset and better judgment of reality is important for handling challenging situations.
For a person suffering from anxiety disorder, it becomes very important to make sure that they know that they are in a safer environment and are cared for. It is very important to make them feel safe and understood. Creating a system of critical thinking and reasoning can also help the person to have a sense of strength and high resistance to vulnerability, this also goes for physical strength. The vulnerability is not only mental it is also physical when it comes to reality.
You will now appreciate why teenagers and trauma patients are more exposed to anxiety disorders. Mostly and generally in teenagers it is due to the uncertainty of many new things happening with them simultaneously and in trauma patients it’s the constant bombardment of life-threatening events in hostile environments.
Conclusion
Anxiety serves to prepare a person for threats. The emotion called anxiety is an evolutionary gift to ensure long survival of our species but as it is also related to our primitive instincts, we mostly let anxiety overpower other emotions in seemingly safer scenarios. Strategy and anticipation are the gifts of anxiety but if overused they will end up in imparting unnecessary caution and overprotective attitude which inhibits adaptation to changes there by slowing evolution of our species. Anxiety just like pain is one uncomfortable but effective way to cope up with the adversities in life, that’s how we build strength, resistance and deeper understanding of the surrounding for better and more precisely predictable future.
The remarkable concepts like smoke detector principal and optimal threshold in signal detection theory developed by modern psychologists/ psychiatrists help us to draw a line between a healthy anxiety (adaptive function) and unhealthy anxiety (pathology) and ways to handle/ treat them effectively.
These theories show how we can quantify seemingly intangible emotions like anxiety and way to handle them. If you can measure something effectively you can control and predict it effectively. All credit goes to such brilliant minds!
Almost half of the population of the world lives in rural regions and mostly in a state of poverty. Such inequalities in human development have been one of the primary reasons for unrest and, in some parts of the world, even violence.
– Dr. A P J Abdul Kalam
Recently, World Happiness Report for the year of 2022 was released and it was very shocking for many Indians that out of 146 countries surveyed, India stood at the position of 136 in terms of the happiest countries in the world. The countries like Myanmar, Sri Lanka, Pakistan, Yemen have still secured better ranks in terms of the happiness index despite having completely opposite socioeconomic imagery in the world. This was the moment when I understood the importance of the key performance parameters of any country.
India didn’t perform well on the list of happiest countries (actually 11th from bottom). When a child secures lower marks in the class then he/she tries to find the bad things that the class topper shows to explain and convince his/her mind and especially parents. In the same naïve sense, I looked towards the neighboring relatively upper ranking countries which have performed better than India. They are far behind India in terms of economy, social environment, quality of life, per capita income, population of youth. Then I realized the parameters on which this was being ranked. The key factors to decide the happiness were GDP per capita, social support, healthy life expectancy, freedom to make life choices, generosity and perception of corruption.
The overall purpose of such socioeconomic surveys and the gap between conclusions drawn from them and the reality people perceive are always good topics for debates, discussions. The World Happiness Report itself is a good example for this. We will see one such simple concept which might give you some insight into the such indicators in the economics.
One of the key factors in deciding the happiness of the nations was the income inequality in the respective countries. Many times, the income inequality has also been linked to the social stability by some psychologist. Jordan Peterson- for example discusses that it is not the countries with less income where the crime rates, riots thereby social instability is high, rather the social instability is high where countries have larger gap between the incomes of poorest of poor and richest of rich. This income inequality and not ‘per capita income’ is strongly linked to the social stability thereby roughly speaking ‘the happiness of people’.
Gini coefficient has explored his domain in a very simple yet effective way, there are some advantages and some disadvantages to it, but it is an interesting concept to understand. When any news articles say that the valley between rich and poor is increasing, they are actually pointing towards the increasing Gini coefficient. You can find the Gini Coefficient for almost all countries on the website of OECD (Organisation for Economic Co-operation and Development).
But, first let us understand Gini Coefficient and Lorenz Curve.
Lorenz Curve
Lorenz curve (Figure 1) is used to graphically represent the distribution of the income within the population. First of all, each member of population is arranged in to the increasing order of income, cumulative income and cumulative member count is considered for the Lorenz curve. The X-axis indicates the cumulative population and Y-axis indicates the cumulative income; it can be taken as percentage also. Lorenz cure will now indicate the fraction of income earned for the respective fraction of population.
Figure 1. Lorenz Curve
What comes after establishing Lorenz Curve is interesting. When we take sum of all the income of nation and divide it by the population earning it, we get average income. But soon it was found that average income is not sufficient enough to compare the economic well-being of any nation.
Let us take an example:
Here we have considered five countries with population of 25 people! (bear with the example for the sake of understanding)
You can see that the average population of each country is 25. By looking at average income of each group one might say that the economic condition of each country is same – that is 4 unit per person, but that might not be the real case. One has to look closely at the data points in each country where importance of Lorenz Curve and Gini Coefficient gets highlighted.
If you compare the incomes in each groups there is specific pattern in the incomes of people. Here, Gini coefficient helps in a better way.
Figure 2. Countries with same average income may not have same income inequality
We need to plot Lorenz curve for each group and segregate the area A and area B as shown in figure 3.
The Gini Coefficient (GC) is defined as follows using Lorenz Curve, here A and B both are areas highlighted in the figure 3:
Figure 3. Area A and Area B from Lorenz Curve for Gini Coefficient calculation
The value of Gini coefficient always lies between 0 to 1. Higher the Gini Coefficient higher is the income inequality.
The lorenz curve and Gini coefficient for our example of Group A, B, C, D, E, F is as given in figure 4.
Figure 4. Lorenz curve and Gini coefficient from data in figure 2
GC=0, Perfect income equality
Now, if one looks at Group A- the income of each member is 4 units thus the Gini coefficient here is 0 indicating the ideal condition of equal income- perfect equality. In reality perfect inequality is not possible as income/wealth is not evenly and exactly distributed all over the nation.
GC=1, Complete income inequality
If one looks at Group F- the average income of the group is still 4 units but the complete income of the group is concentrated to only one person of the group which is the ideal inequality, here the Gini Coefficient is 1 indicating complete income inequality.
These are the ideal condition to compare with the real conditions.
Now let us look at the Groups B, C, D, E. Here, the average income in each group is same as 4 units, but if you start plotting them in the form of Lorenz curve, you will notice the difference in the income distribution throughout each group. The income distribution in each group is not same even though the average income is the same.
If we find the Gini Coefficient for each group, the values are given as GCB=0.16, GCC=0.42, GCD=0.53, GCE=0.82.
In short, the Gini Coefficient gives much more important information than per capita income.
Poor Countries have Gini Coefficient values scattered all over the range on as low as 0.25 to as high as 0.71. Generally, it is observed from the historical data that the countries with Gini coefficient higher than 0.40 indicate highly socioeconomic instability.
The main advantage of Gini coefficient is that it highlights how much wealth is owned by the fraction of people for a given country.
It is also interesting to notice that the country with rising GDP and rising Gini Coefficient indicate increasing poverty in the country.
Gini coefficient does not consider the size of the economy because all the income and all the population are compressed to the scale of 100% thus any two economies can be easily compared on some common parameters using respective Gini Coefficients.
The main power of Gini Coefficient is that just a simple number can give you the idea of overall income distribution in the country.
There are some ‘lost in the calculation’ details in Gini Coefficient that one needs to understand before commenting on any nation’s economy just by looking at its Gini Coefficient.
It is observed that the countries with relatively larger population and cultural diversity will yield higher Gini Coefficient than its each individual state and relatively smaller coparing countries.
Gini coefficient does not consider the dependence of basic necessities with the income. Some countries have systems like food stamps or food ration which may not be counted as monetary incomes, thus it becomes important to understand the culture and lifestyle, availability of basic facilities while comparing countries based on Gini Coefficients.
The Gini Coefficient will yield different values for the same country if base data varies as income of individual or income of household. As we know, all of the population of the country is not earning population; there are some children, young adults, elders, even young men and women who are not earning population. Hence, it becomes more practical to consider the Gini Coefficient based on the household income and considering the weightage of each family member behind that income. This will give more practical Gini Coefficients. There are three famous ways to calculate Gini based on this idea called as Per Household Member Scale, Modified OECD (Organization for Economic Co-operation and Development) Scale and Square Root Scale.
Per household scale distributes the income of the family equally irrespective of their earning potential and age. Modified OECD Scale distributes the income in the family members as per their earning potential and age- the main earning person will have more weightage that the children dependent on him/her in this scale. Square root scale simply divides the income of family into the square root of family members count. These all scale will yield different Gini Coefficients and are used to derive specific meanings for the economy.
During many studies it is also found that the Gini Coefficients of given group are less sensitive to top 10% and bottom 10% population. Gini coefficients are more sensitive to the middle fraction of populations and wealth associated to it.
Though Gini coefficient has its limitations, but it is still the most simple and effective way to visualize and compare the income/ wealth inequality of any nation.
Economists have attempted to eliminate these limitations by incorporating various other indicators or techniques like Atkins Index, Coefficient of variation, Decile Ratios, Generalized Entropy Index, Kakwani progressivity index, Robin Hood index, Sen poverty measure, proportion of the total income earned.