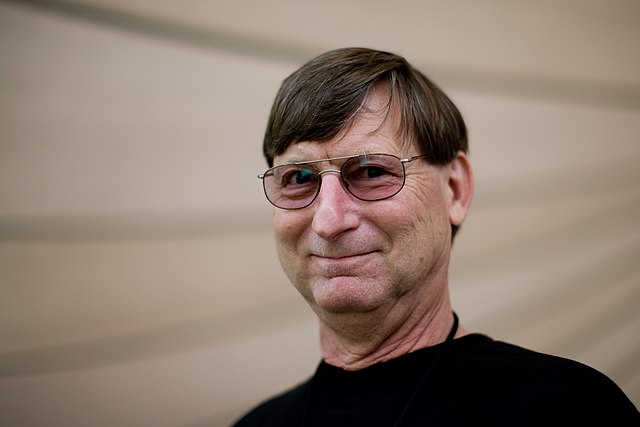
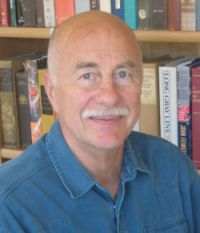
Daniel Kahneman and Amos Tversky’s Prospect theory in economics
Prospect theory is one of the most important ideas of behavioral economics. It shows how people make choices when times are highly uncertain. Rationally, any person would go with the choices having the best probable outcomes in uncertain times but in real scenarios that is not the case. Real people are emotional and always have mindset of survival. That is exactly why in uncertain times, people choose anything that has complete surety, certainty of gain instead of gambling for higher gains however highly probable they may be. And when probable gains are very high than average gains people will choose higher gains even when they have very less probability. This irrational, non-economical behavior may make human decision seem illogical, inconsistent. This illogical behavior is an important part of our evolution as species which Nobel Laureate Daniel Kahneman’s Prospect theory highlights. We will throw more light on prospect theory hereon.
Expected Utility Theory
“The agent of economic theory is rational, selfish, and his tastes do not change.”
Expected utility theory lies at the foundations of economics. It allows economists to model the scenarios to understand the dynamics between the resources, their perceived value and the risks/ uncertainties involved in any transaction.
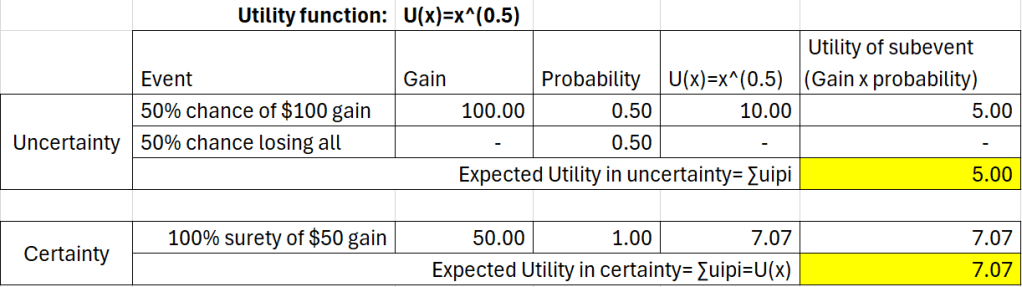
The basic idea behind expected utility theory is that for any given set of uncertain events, a rational agent considers the weighted average of all gains based on the probabilities. The rational agent makes decision based on overall gains rather than being biased towards certain high value gains or certain highly probable gains.
For those who want more details, I have written in depth on the expected utility theory.
Prospect Theory
Although expected utility is one of the fundamental concepts of economics, the assumptions on which it stands have their own limitations. So, expected utility theory is not a complete and absolute theory to understand and predict the behavior of agents in economics. The moment we are injecting the word “behavior” we must understand that humans are not a purely mechanical or mathematical thinkers – decision makers. Also, as per the expected utility theory, there can be different perception of the value for given same resource for different agents. What expected utility immediately does is to fully attach the perception of value of given gain only with the bulk of resource that agent already has and the value addition it would do to this already existing bunch of resource. There is no psychological element in this discussion which is a larger predictor of the behavior of the agents in economics.
So, you can call prospect theory as an augmentation of expected utility theory. Prospect theory is not meant to falsify the expected utility theory rather it helps EUT to evolve where its own assumptions fail to explain the behavioral decision of the agents.
Modern economists are making more efforts to incorporate the psychological aspects of decision making into the machine-like purely mathematical models of economics. This makes the predictions more realistic when human decision making is involved. Daniel Kahneman and Amos Tversky published their world-famous paper called ‘Prospect theory: An analysis of decision under risk’ in ‘Econometrica’ in 1979. This paper is one of the most cited papers in economics. Prospect theory thus became the cornerstone of behavioral economics.
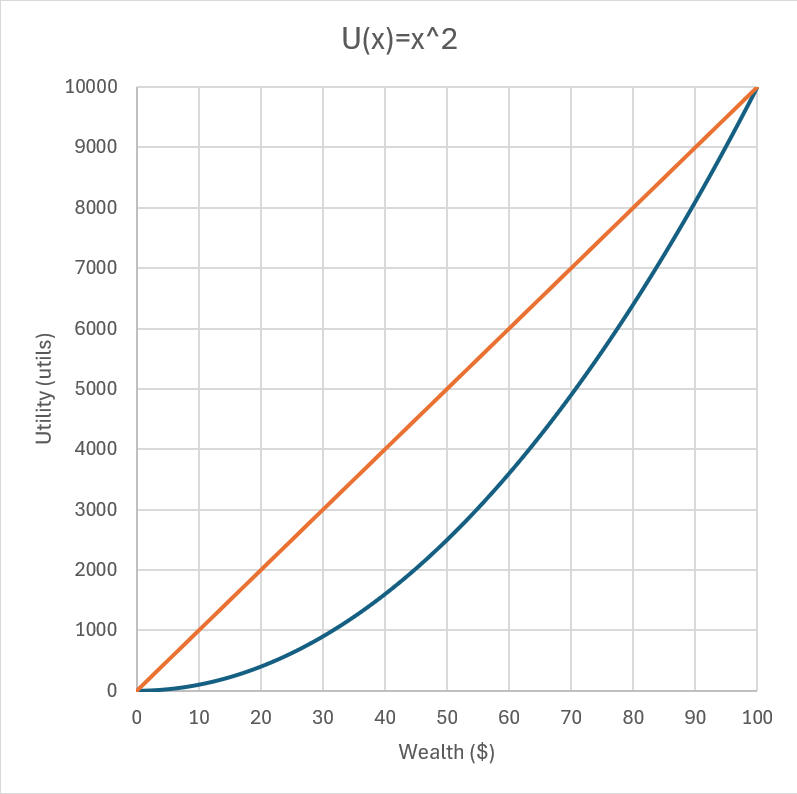
Kahneman and Tversky pointed out one “theoretical blindness” imparted due to the EUT. We will see those details in depth. They pointed out certain effects based on the decision making of the subjects under different decision-making events. Collection of these effects makes the prospect theory important. The important point to keep in mind is that everyone is risk averse in reality. Nobody wants to choose the transaction where there expected utility is reduced. So, the utility function of agents is concave.
Certainty effect
People overweight outcomes that are considered certain, relative to outcomes which are merely probable.
According to EUT, people will weigh out the outcomes based on their probabilities, but Kahneman-Tversky found out that people love certainty of gains. People don’t want to get involved into gambles when they know that there another way to gain something “closely valuable” for sure.
Kahneman-Tversky presented an interesting observation in their paper, here are the exact scenarios:
Choose between
A: Gain of 2500 with probability 0.33
Gain of 2400 with probability 0.66
Gain of 0 with probability 0.01
OR
B: Gain of 2400 with certainty
According to the EUT the utility equivalent of A can be calculated as
U(A) = (2500 x 0.33) + (2400 x 0.66) + (0 x 0.01) = 2409
And utility equivalent of B
U(B) = (2400 x 1) =2400
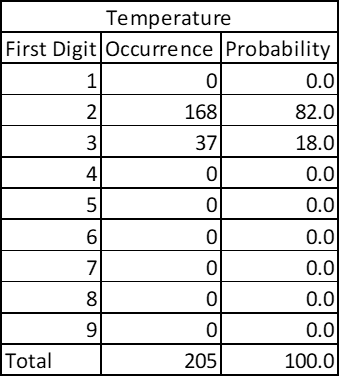
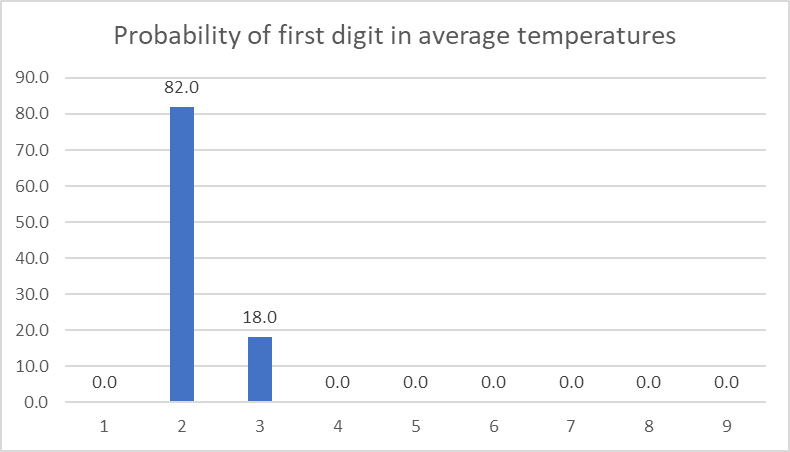
So, according to EUT the utility of A is higher than B. But you already have your answer ready in your mind. Same was observed by Kahneman- Tversky; 82% of the people choose event B where the gain was certain.
Does this mean that the more probable the gain the more preferred it will be?
The answer is complicated.
Kahneman- Tversky further posed a modified event,
Choose between
C: Gain of 2500 with probability 0.33
Gain of 0 with probability 0.67
OR
D: Gain of 2400 with probability 0.34
Gain of 0 with probability 0.66
They observed that 83% of the people chose event C over event D. This was surprising because event D is mathematically more significant (probability of 0.34 in D over 0.33 in C). This shows that it’s not just about the higher certainty which drives the preferences. The moment given options are uncertain people rarely notice the extent of the uncertainty (numerical value of probability) to choose between.
Take one more example given by Kahneman-Tversky
A: Gain of 4000 with probability 0.80
OR
B: Gain of 3000 for sure
Here 80% of people chose B.
But when presented following:
C: Gain of 4000 with probability 0.20
OR
D: Gain of 3000 with probability 0.25
Here 65% people chose C.
What exactly is happening here?
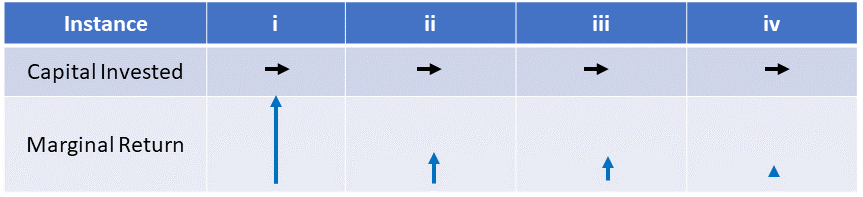
People love sure gains over any uncertain gains. But when both or all of the presented gains are uncertain, people will choose to gamble with those giving higher gain, whatever may be the possibility. This goes against EUT which says rational people would consider both the gain and the probability while making a decision. In reality when people are uncertain, they choose to go with the uncertain but higher chances of gaining.
You will now start to notice that EUT creates an objectivity in the choices by mathematically connecting the gains with their probability. But Kahneman-Tversky observed that real people will not follow EUT, they will make decisions based on the prospects they are presented. People never look at the scenarios in economics as distinct events, they look at the current trade-offs, current prospects they a have at their disposal to choose. The choice is always relative to the prospects presented and not absolute like EUT asks for in a mathematical form. That is exactly why Prospect Theory becomes important. It’s neither about the certainty nor the value, its more about what type of options – prospects you are providing to the people.
This is one important idea in marketing. We will see that in detail as the discussion evolves.
There is an interesting observation by Kahneman-Tversky when we are observing relativity of the prospects:
Choose between
A: Gain of 6000 with probability of 0.45
OR
B: Gain of 3000 with probability of 0.90
86% of the people chose prospect B.
If you use EUT, both prospects have same utility equivalent = (6000 x 0.45) = (3000 x 0.9) = 2700.
But people refuse to be indifferent to these prospects and choose the most certain prospect.
Now, one more – same gains but totally different probabilities,
Choose between
A: Gain of 6000 with probability of 0.001
OR
B: Gain of 3000 with probability of 0.002
Here, 73% of the people chose prospect A.
Again, both have same utility equivalent = (6000 x 0.001) = (3000 x 0.002) = 6. According to EUT people should be indifferent to both prospects.
And interestingly they didn’t go with the one which is more certain than other. They went the one with larger gain. This is because both prospects have very slim chances of gains.
Now it should be pretty clear that people compare prospects based on what is presented to them. Even when they are risk aversive, they would prefer bigger gambles when they realize that the chances of winning are really low and there is pretty much nothing to lose.
Reflection Effect
The risk aversion in the positive domain is accompanied by risk seeking in the negative domain
Certainty increases the aversiveness of losses as well as desirability of gains.
We saw how people choose when they have information of higher certainty or higher gains. What would happen if we inform them about lower certainty or lower gains/ higher losses?
We already saw one observation from Kahneman-Tversky:
A: Gain of 4000 with probability 0.80
OR
B: Gain of 3000 for sure
80% of people chose B because they preferred surety of gain.
Kahneman-Tversky posed exact negative of this prospect which looks like
A: Loss of 4000 with probability 0.80
OR
B: Loss of 3000 for sure
Now, 92% of the people chose option A. They don’t want a prospect where loss is certain.
Kahneman-Tversky observed that when prospects are negated people switched sides. The risk aversion in positive prospects changed to risk seeking which goes against EUT. They called it the reflection effect.
See this already discussed prospect:
Choose between
A: Gain of 6000 with probability of 0.001
OR
B: Gain of 3000 with probability of
73% of the people chose prospect A.
The negative of this would be:
Choose between
A: Loss of 6000 with probability of 0.001
OR
B: Loss of 3000 with probability of 0.002
Kahneman-Tversky observed that 70% of the people chose prospect B.
When it came to losses, people chose prospect with more certainty of lower loss.
This is very interesting observation. If you still cannot wrap your mind around this, the simplification looks like this: People rarely care about the combined effect of gains/losses with the probabilities as the expected utility theory rationally establishes. People care about what current choices they have and choose those which guarantee highly certain gains even when they are low and choose lower losses when they are highly certain.
“…it appears that certainty increases the aversiveness of losses as well as the desirability of gains”
Isolation effect
In order to simplify the choices between alternatives, people often disregard components that the alternatives share, and focus on the components that distinguish them.
The core of this idea is that people don’t like complexity or our brain is always trying to take shortcuts. This is one important idea and observation on human nature which Kahneman-Tversky pointed out.
What they did is creating a two-stage game:
1st Stage-
P: Gain of 0 with probability of 0.75
OR
Q: Move to 2nd stage of the game with probability of 0.25
2nd Stage-
R: Gain of 4000 with probability of 0.8
OR
S: Gain of 3000 for certainty
The condition here is that choices must be made before the game is played i.e., before the actual outcome becomes apparent.
Before we go to what Kahneman-Tversky observed. Let us see what EUT would prefer, what a rational person would prefer:
U(R) = The equivalent utility of gaining 4000 at the end of the game = 4000 x (probability of reaching 2nd stage from 1st stage) x (probability of gain of 4000) = 4000 x 0.25 x 0.8 = 800
U(S) = The equivalent utility of gaining 3000 at the end of the game = 3000 x (probability of reaching 2nd stage from 1st stage) x (probability of gain of 3000) = 3000 x 0.25 x 1 = 750
So, U(R) > U(S). Thus, any rational person would choose prospect R in any situation as per the EUT goes.
Pay attention here,
The added complexity due to multiple stages –
When people were presented with the above mentioned two stage scenarios, 78% of the people chose the prospect giving certain gain i.e., gain of 3000 for sure. But, according to EUT you will see that this chosen prospect has lover equivalent utility. People actually ignored (or didn’t account for) the effect of the first stage of probability which would allow them to enter the actual stage 2.
Kahneman-Tversky called this an Isolation effect where people isolate or don’t care the commonalities between presented scenarios to make the decision-making process less complicated.
Now, this 2-stage game can be reduced to single stage game as follows:
Choose between
A: Coming to current stage with 0.25 chance where there is 0.8 chance to gain 4000
(0.25 x 0.8) chance to gain 4000
Gain of 4000 with probability of 0.20
OR
B: Coming to current stage with 0.25 chance where there is certainty to gain 3000
(0.25 x 1) chance to gain 3000
Gain of 3000 with probability of 0.25
This is a reduced form of the prospect.
If EUT is applied here
U(A) = 4000 x 0.20 = 800 and U(B) = 3000 x 0.25 = 750.
The 2-stage game and its reduced form obviously will have exactly same equivalent utilities because the reduced form just combines the chances of two stages into one resultant number. So, even though these two scenarios have same outcomes of equivalent utilities, Kahneman- Tversky observed that the ways in which these scenarios are presented affect the choices of the people.
Kahneman-Tversky had already observed that when there is significantly less difference in the amounts of gains or the probability of those respective gains in two prospects, people mostly prefer the one with higher gains. So, if we present this above mentioned 2-stage scenario to its reduced single stage scenario the results are interesting.
We have already seen what Kahneman-Tversky observed for this reduced scenario. Majority of people chose higher gain prospect even though it was relatively less probable.
Conclusion
What Kahneman-Tversky did concretely in prospect theory is to formulate the value function to mathematically explain this behavior.
The value function in prospect theory is given as follows:

The simplified idea of this value function is:
The pain of losing certain amount hurts us more that the joy of gaining the same amount.
You just like winning and dislike losing – and you almost certainly dislike losing more than you like winning.
The importance of prospect theory is that it shows what it means to be a human. Once you start collecting the pieces of certainty effect, reflection effect and isolation effect the picture that is revealed is profound insight about our tendencies to ensure survival in any case.
Certainty effect shows that people will choose certain gains even if their size is low. They just want to be at peace with increasing their existing surplus if it is sure.
This is how the coupon codes, vouchers, discount codes, discount days work in online shopping. The provider lures you into buying something you really don’t want by giving you guarantee, surety that you surely are making profit out of this deal. One smart thing that happens here is that the sense of urgency. You might have realized that these coupons are expiring immediately like virtually now. This creates an urgency to materialize the profit.
When people are in profit making environment, they will always prefer sure profit over uncertain profits and that is exactly how scammers lure people. They create this sense of surety to attract people to invest in their schemes.
No wonder why people love easy money. Once you inject the surety of gains in any venture people will literally pile up and that is how Ponzi schemes, Pyramid schemes work.
The moment this surety of gain is lost and when people realize that it is only the losses that they will have to face then immediately this same population craves for uncertainty in the losses. When people see that they anyways have to digest the losses they avoid certain losses over uncertain ones, even if the actual effect of certain losses was pretty low. This is reflection effect.
The stock market is the best example to explain the reflection effect. In the crisis times – bearish markets, history has evidences that people have gone with insanely foolish bets where chances of gains are slim to none. People end up in the cycles of betting, gambling even when the realistic indicators of market are pointing to inevitable crisis.
The important thing to appreciate from prospect theory is to know when and where to stop in crisis situations.
“…people become risk seeking when all their options are bad”
If you have lost this game in poker or any gamble, you always feel that I will play the next game and definitely (somehow) will recover my losses (even when I know that James Bond is sitting on my table).
You will be more relaxed if you were told in advance that you will make less money of $10000 and you will be more stressed, feel pain if you make $12000 and government cuts $2000 for some taxation at the last moment. The gain is same but the “prospects” are different.
People can be confused to choose the loss-making options even when they are completely informed. When decision making is multi-stage so that there are some common things between them, people usually neglect those shared attributes even if they are significant and move on to the differences to finalize the choice even if these differences are not significant. This is isolation effect.
Many electronics companies while creating their pricing strategies intentionally create shared features and smartly just add one low-cost additional feature in the top model to sell it at foolishly, unjustifiably higher cost. People are ready to pay higher prices for that low cost (for the manufacturer/ marketeer) because it makes that model better. (You know who I am talking about.)
For me, the isolation effect has a huge philosophical implication.
Kahneman-Tversky have attributed the behaviors pointed out by Prospect theory to the tendency for survival. If you want to survive and are living in an already good situation then you would not want to disturb the current resources you have, that is why you don’t prefer uncertain gains, you are more than happy if the gains are certain even if they are small in size because they are not disturbing the already materialized gains.
In same way when conditions to survive are hostile you would take that every chance to increase your resources, however slim the chances may be. This is some kind of indication of hope. Important thing about Prospect theory is that Kahneman-Tversky pointed out that this exact risk-taking tendency in negative environment can push people into the spiral of continuous losses.
We are naturally evolved in this way.
The isolation effect outlines our tendency to eliminate common/ shared attributes of given resource to make a choice. The key thing to appreciate here is that while neglecting these commonalities we are never conscious of how significant they are in our life. You must appreciate that when I am writing this, sharing this, when you are reading this, we have more than enough resources to sustain a basic life. We are living better life than most of the world population but still we are not satisfied because we have already isolated that which we have with us. The isolation effect thus points out to our tendency to lose the feeling of gratitude for everything we have right now.
We rarely appreciate things which we already have or things we are sure that we would never loose. Many times, people realize the worth of things as really significant – as truly valuable when they are lost.
Being alive and having the ability to experience – to appreciate this life is what common to all of us, this is precious than anything else in this world, rest is just the bonus. We should not let the practice of comparison isolate this preciousness.
References and further reading:
- Kahneman, Daniel., and Amos Tversky. “Prospect theory: An analysis of decision under risk.” Econometrica 47.2 (1979): 363-391
- Thinking fast and slow – Daniel Kahneman
- Risk and Rationality in Uncertainty – On Expected Utility Theory
- Connecting money with sentiments – Behavioral Economics