
Benford’s Law for natural datasets and financial fraud detection
People can find patterns in all kinds of random events. It is called apophenia. It is the tendency we humans have to find meaning in disconnected information.
Dan Chaon, American Novelist
Is There Any Meaning in Randomness?
We all understand that life without numbers is meaningless. Every single moment gazillions and gazillions of numbers are getting generated. Even when I am typing this and when you are reading this – some mathematical processing is happening in bits of the computer to make it happen. If we try to grasp/understand the quantity of numbers that are getting generated continuously, even the lifetime equivalent to the age of our Universe (13.7 billion) will fall short.
Mathematics can be attributed to an art of finding patterns based on certain set of reasoning. You have certain observations which are always true and you use these truths to establish the bigger truths. Psychologically we humans are tuned to pattern recognition, patterns bring in that predictability, predictability brings in safety because one has knowledge of future to certain extent which guarantees the higher chances of survival. So, larger understanding of mathematics in a way ensures better chances of survival per say. This is oversimplification, but you get the point.
Right from understanding the patterns in the cycles of days and nights, summers, and winters till the patterns in movements of the celestial bodies, the vibration of atoms, we have had many breakthroughs in the “pattern recognition”. If one is successful enough to develop a structured and objective reasoning behind such patterns, then predicting the fate of any process happening (and would be happening) which follows that pattern is a piece of cake. Thus, the power to see the patterns in the randomness is kind of a superpower that we humans possess. It’s like a crude version of mini-time machine.
Randomness inherently means that it is difficult to make any sense of the given condition, we cannot predict it effectively. Mathematics is one powerful tool to make sense out of randomness but bear in mind that not every randomness could be handled effectively with the mathematical tools we have at our disposal today. Mathematics is still evolving and will continue to evolve and there is not end to this evolution – we will never know everything that is there to know. (it’s not a feeling rather it is proved by Gödel’s incompleteness theorem.)
You must also appreciate that to see the patterns in any given randomness, one needs to create a totally different perspective. Once this perspective is developed then it no longer remains random. So, every randomness is random until we don’t have a different perspective about it.
So, is there any way to have a perspective on the gazillions of the numbers getting generated around us during transactions, interactions, transformations?
The answer is Yes! Definitely, there is a pattern in this randomness!!
Today we will be seeing that pattern in detail.
Natural Series – Real Life Data
Take your account statement for an example. You will see all your transactions, debit amount, credit amount, current balance in the account. There is no way to make sense out of how the numbers that are generated, the only logic behind those numbers in account statement is that you paid someone certain amount and someone paid you certain amount. It is just net balance of those transactions. You had certain urgency someday that is why you spent certain amount on that day, you once had craving for that cake hence you bought that cake, you were rooting for that concert ticket hence you paid for that ticket, on one bad day you faced certain emergency and had to pay the bills to sort things out. Similarly, you did your job/ work hence you got compensated for those tasks – someone paid you for that, you saved some funds in deposits and hence that interest was paid to you, you sold some stocks hence that value was paid to you.
The reason to explain this example to such details is to clarify that even though you have control over your funds, you actually cannot control every penny in your account to that exact number that you desire. This is an example of natural data series. Even though you have full control over your transactions, how you account will turn out is driven by certain fundamental rules of debit/ credit and interest. The interactions of these accounting phenomenon are so intertwined that ultimately it becomes difficult to predict down to every last penny.
Rainfall all around the Earth is very difficult to predict to its highest precision due to many intermingling and unpredictable events in nature. So, by default finding trend in the average rainfall happened in given set of places is difficult. But we deep down know that if we know certain things about rainfall in given regions we can make better predictions about other regions in a better way, because there are certain fundamental predictable laws which govern the rainfall.
The GDP of the nations (if reported transparently) is also very difficult to pin down to exact number, we always have an estimate, because there are many factors which affect that final number, same goes for the population, we can only predict how it would grow but it is difficult to pin point the number.
These are all examples of real life data points which are generated randomly during natural activities, natural transactions. We know the reason for these numbers but as the factors involved are so many it is very difficult to find the pattern in this randomness.
I Lied – There is A Pattern in The Natural Randomness!
What if I told you that there is certain trend and reference to the randomness of the numbers generated “naturally”? Be cautious – I am not saying that I can predict the market trend of certain stocks; I am saying that the numbers generated in any natural processes have preference – the pattern is not predictive rather it only reveals when you have certain bunch of data already at hand – it is retrospective.
Even though it is retrospective, it can help us to identify what was manipulated, whether someone tried to tamper with the natural flow of the process, whether there was a mechanical/ instrument bias in data generation, whether there was any human bias in the data generation?
Logarithm and Newcomb
Simon Newcomb (1835-1909) a Canadian-American astronomer once realized that his colleagues are using the initial pages of log table more than the other pages. The starting pages of log tables were more soiled, used than the later pages.
Log tables were instrumental in number crunching before the invention of any type of calculators. The log tables start with 10 and end in 99.
Newcomb felt that the people using log tables for their calculations have more 1’s in their datasets repetitively in early digits that is why the initial pages where the numbers start with 1 are used more. He also knew that the numbers used in such astronomical calculations are the numbers available naturally. These numbers are not generated out randomly, they signify certain quantities attributed to the things available in nature (like diameter of a planet, distance between stars, intensity of light, radius of curvature of certain planet’s orbit). These were not some “cooked up” numbers, even though they were random but they had natural reason to exist in a way.
He published an article about this but it went unnoticed as there was no way to justify this in a mathematical way. His publication lacked that mathematical rigor to justify his intuition.
Newcomb wrote:
“That the ten digits do not occur with equal frequency must be evident to anyone making much use of logarithmic tables, and noticing how much faster the first one wears out than the last ones.”
On superficial inquiry, anyone would feel that this observation is biased. It seemed counterintuitive, also Newcomb just reported the observation and did not explain in detail why it would happen. So, this observation went underground with the flow of time.
Frank Benford and The Law of Anomalous Numbers
Question – for a big enough dataset, how frequently any number would appear in first place? What is the probability of numbers from 1 to 9 to be the leading digit in given dataset?
Intuitively, one would think that any number can happen to be in the leading place for given dataset. If the dataset becomes large enough, all nine numbers will have equal chance to be in first place.
Frank Benford during his tenure in General Electric as a physicist made same observation about the log table as did Newcomb before him. But this time Frank traced back the experiments and hence the datasets from these experiments for which the log table was used and also some other data sets from magazines. He compiled some 20,000 data points from completely unrelated experiments and found one unique pattern!
He realized that even though our intuition says that any number from 1 to 9 could appear as the leading digit with equal chance, “natural data” does not accept that equal chance. The term “Natural data” refers to the data representing any quantifiable attribution of real phenomenon, object around us, it is not a random number created purposefully or mechanically; it has some origin in nature however random it may seem.
Frank Benford thus discovered an anomaly in natural datasets that their leading digit is more 1 or two than the remaining ones (3,4,5,6,7,8,9). In simple words, you will see 1 as leading digit more often in the natural datasets than the rest of the numbers. As we go on with other numbers the chances that other numbers will be frequent in leading position are very less.
In simple words, any naturally occurring entity will have more frequent 1’s in its leading digits that the rest numbers.
Here is the sample of the datasets Frank Benford used to find this pattern:
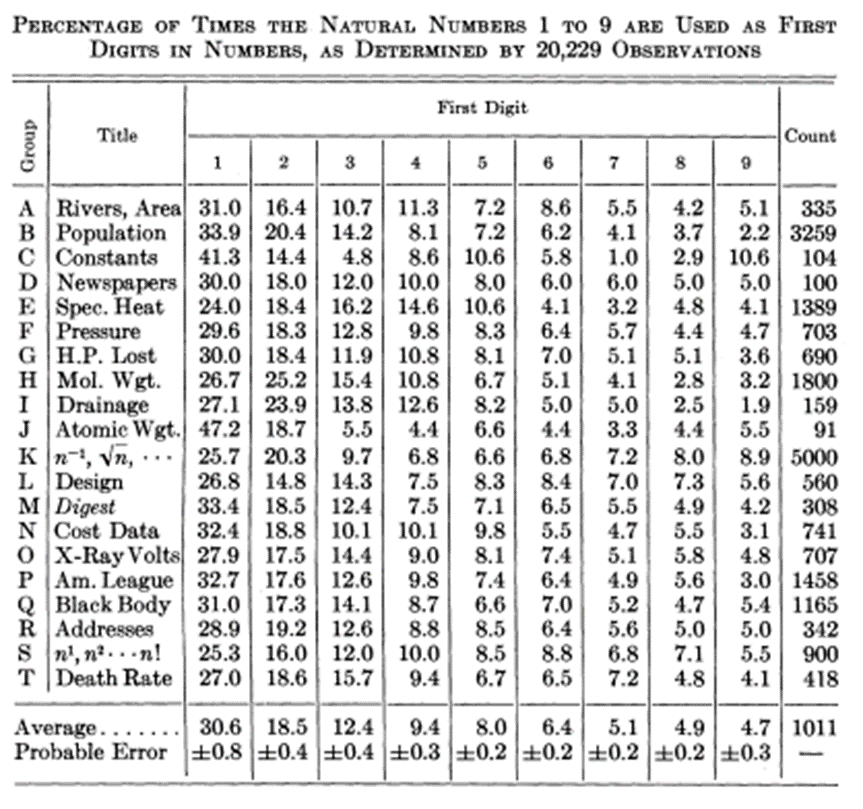
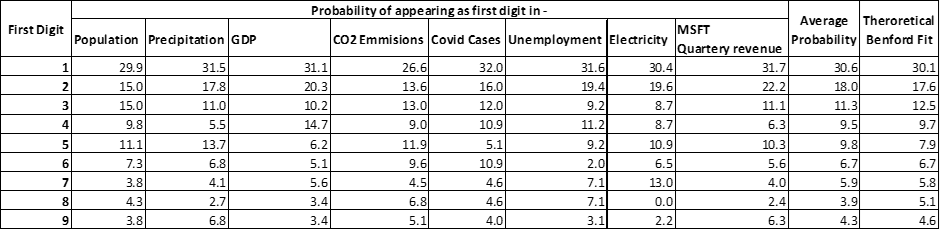
So, according to Benford’s observations for any given “natural dataset” the chance of 1 being the leading digit (the first digit of the number) is almost 30%. 30% of the digits in given natural dataset will start with 1 and as we go on the chances of other numbers to appear frequent drop drastically. Meaning that very few number in given natural data set will start with 7,8,9.
Thus, the statement of Benford’s law is given as:
The frequency of the first digit in a populations’ numbers decreases with the increasing value of the number in the first digit.
Simply explained, as we go on from 1 to 9 as first digit in given dataset, the possibility of their reappearance goes on reducing.
1 will be the most repeated as the first number then 2 will be frequent but not more than 1 and the frequency of reappearance will reduce and flatten out till 9. 9 will rarely be seen as the leading digit.
The reason why this behavior is called as Benford’s Law (and not Newcomb’s Law) is due to the mathematical equation that Benford established.
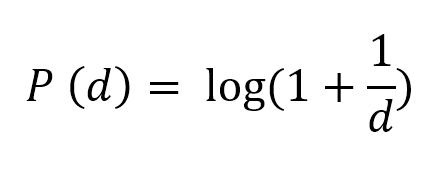
Where, P(d) is the probability that a number starts with digit d. Digit d could be anything 1,2,3,4,5,6,8 or 9.
If we see the real-life examples, you will instantly realize how counterintuitive this law is and still nature chooses to follow it.
Here are some examples:
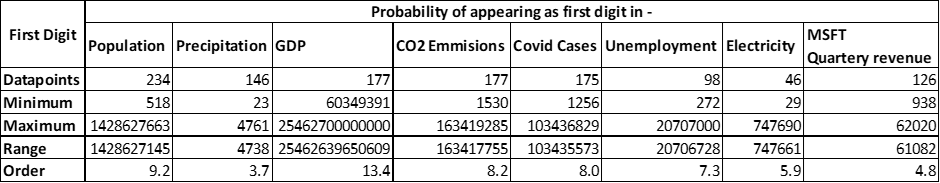
I have also attached an excel sheet for complete datasets and to demonstrate how simply one can calculate and verify Benford’s law.
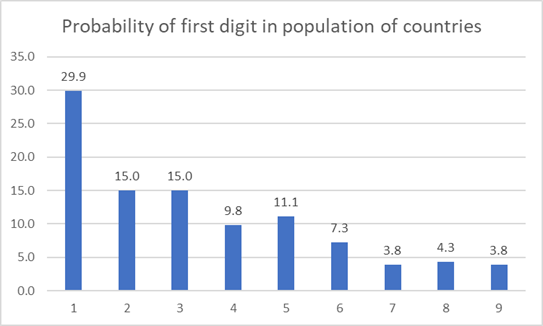
Population of countries in the world –
The dataset contains population of 234 regions in the world. And you will see that 1 appears the most as first digit in this dataset. Most of the population numbers start with 1 (70 times out of 234) and rarely with 9 (9 times out of 234)

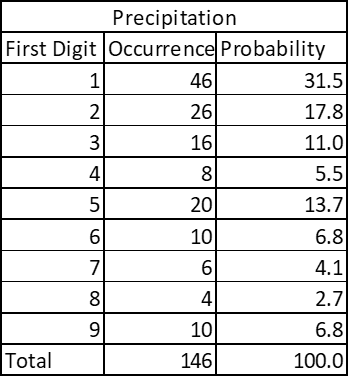
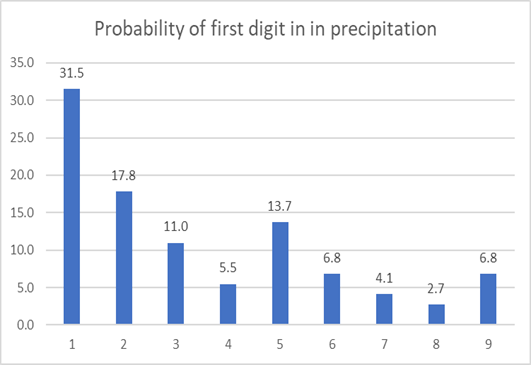
Country-wise average precipitation –
The dataset contains average rainfall from 146 countries in the world. Again, same pattern emerges.
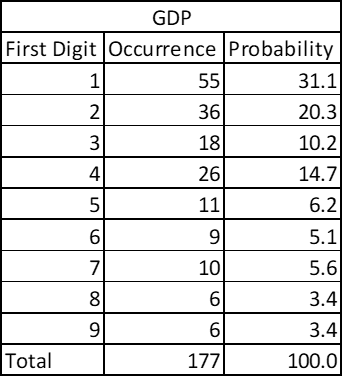
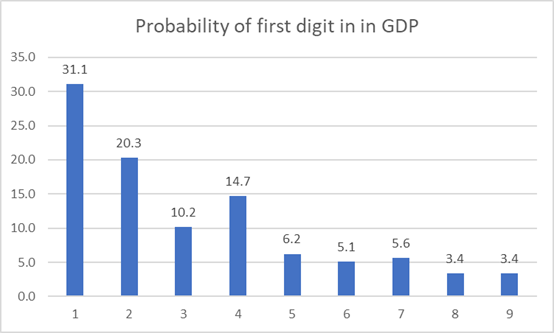
Country wise Gross Domestic Product –
The dataset contains 177 countries’ GDP in USD. See the probability yourself:
Country-wise CO2 emissions:
The data contains 177 entries


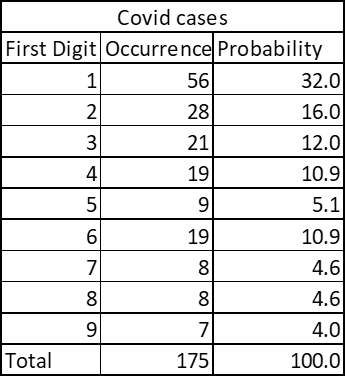
Country wise Covid cases:

Here is one more interesting example:
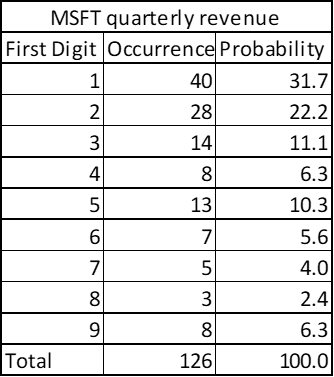
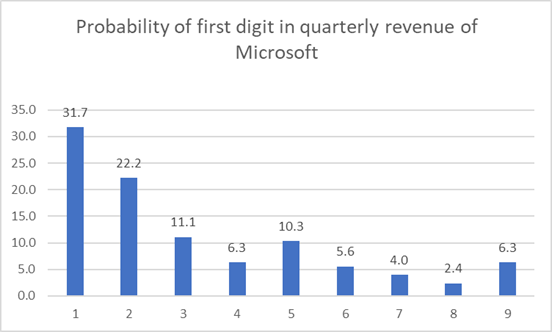
The quarterly revenue of Microsoft since its listing also shows pattern of Benford’s Law!
To generalize we can find the trend of all these data points by averaging as follows:
This is exactly how Benford avearaged his data points to establish a generalized equation.
Theoretical Benford fit is calculated using the Benford equation expressed earlier.

So here is the relationship graphically:
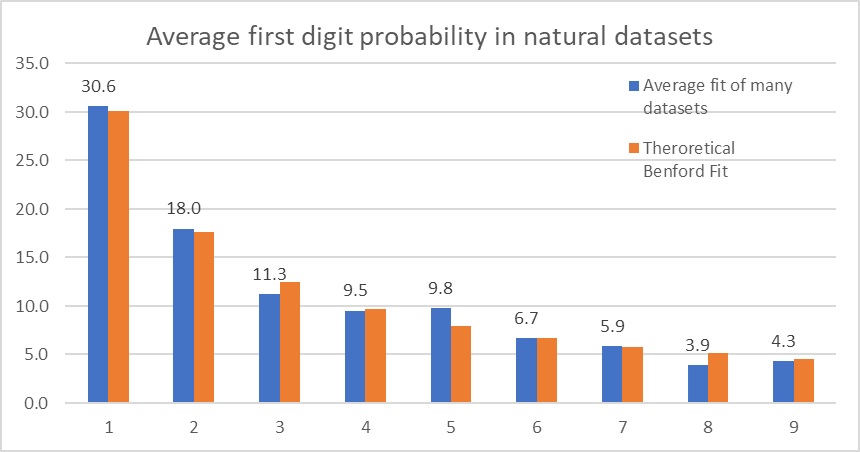
Now, you will appreciate the beauty of Benford’s law and despite seeming counterintuitive, it proves how seemingly random natural dataset has preferences.
Benford’s Law in Fraud Detection

In his 1938 paper “The Law of Anomalous Numbers” Frank Benford beautifully showed the pattern that natural datasets prefer but he did not identify any uses of this phenomena.
1970 – Hal Varian, a Professor in University of California Berkely School of Information explained that this law could be used to detect possible fraud in any presented socioeconomic information.

1988 – Ted Hill, an American mathematician found out that people cannot cook up some numbers and still stick to the Benford’s Law.

When people try to cook up some numbers in big data sets, they reflect certain biases to certain numbers, however random number they may put in the entries there is a reflection of their preference to certain numbers. Forensic accountants are well aware of this fact.
1992 – Mark Nigrini, a South African chartered accountant published how Benford’s law could be used for fraud detection in his thesis.

Benford’s Law is allowed as a proof to demonstrate accounts fraud in US courts at all levels and is also used internationally to prove finance frauds.
It is very important to point the human factor, psychological factor of a person who is committing such numbers fraud. People do not naturally assume that some digits occur more frequently while cooking up numbers. Even when we would start generating random numbers in our mind, our subconscious preference to certain numbers gives a pattern. Larger the data size more it will lean to Benford’s behavior and easier will be the fraud detection.
Now, I pose one question here!
If the fraudster understands that there is such thing like Benford’s Law, then wouldn’t he cook up numbers which seem to follow the Benford’s Law? (Don’t doubt my intentions, I am just like a cop thinking like thieves to anticipate their next move!!!)
So, the answer to this doubt is hopeful!
The data generated in account statements is so huge and has multiple magnitudes that it is very difficult for a human mind to cook up numbers artificially and evade from detection.
Also, forensic accountants have showed that Benford’s Law is a partially negative rule; this means that if the law is not followed then it is possible that the dataset was tampered/ manipulated but conversely if the data set fits exactly / snuggly with the Benford’s law then also there is a chance that the data was tampered. Someone made sure that the cooked-up data would fit the Benford’s Law to avoid doubts!
Limitations of Benford’s Law
You must appreciate that nature has its ways to prefer certain digits in its creations. Random numbers generated by computer do not follow Benford’s Law thereby showing their artificiality.
Wherever there is natural dataset, the Benford’ Law will hold true.
1961 – Roger Pinkham established one important observation for any natural dataset thereby Benford’s Law. Pinkham said that for any law to demonstrate the behavior of natural dataset, it must be independent of scale. Meaning that any law showing nature’s pattern must be scale invariant.
In really simple words, if I change the units of given natural dataset, the Benford law will still hold true. If given account transactions in US Dollars for which Benford’s Law is holding true, the same money expressed in Indian Rupees will still abide to the Benford’s Law. Converting Dollars to Rupees is scaling the dataset. That is exactly why Benford’s Law is really robust!
After understanding all these features of Benford’s Law, one must think it like a weapon which holds enormous power! So, let us have some clarity on where it fails.
- Benford’s Law is reflected in large datasets. Few entries in a data series will rarely show Benford’s Law. Not just large dataset but the bigger order of magnitude must also be there to be able to apply Benford’s Law effectively.
- The data must describe same object. Meaning that the dataset should be of one feature like debit only dataset, credit only dataset, number of unemployed people per 1000 people in population. Mixture of datapoints will not reflect fit to Benford’s Law.
- There should not be inherently defined upper and lower bound to the dataset. For example, 1 million datapoints of height of people will not follow Benford’s Law, because human heights do not vary drastically, very few people are exceptionally tall or short. This, also means that any dataset which follows Normal Distribution (Bell Curve behavior) will not follow Benford’s Law.
- The numbers should not be defined with certain conscious rules like mobile numbers which compulsorily start with 7,8, or 9; like number plates restricted 4, 8,12 digits only.
- Benford’s Law will never pinpoint where exactly fraud has happened. There will always be need for in depth investigation to locate the event and location of the fraud. Benford’s Law only ensures that the big picture is holding true.
Hence, the examples I presented earlier to show the beauty of Benford’s Law are purposefully selected to not have these limitations. These datasets have not bounds, the order of magnitude of data is big, range is really wide compared to the number of observations.
Now, if I try to implement the Benford’s Law to the yearly revenue of Microsoft it reflects something like this:
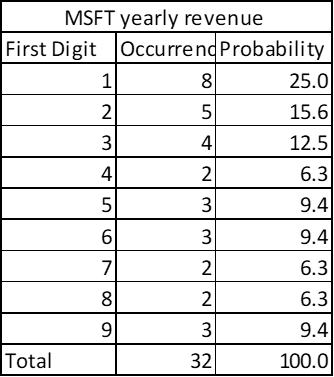
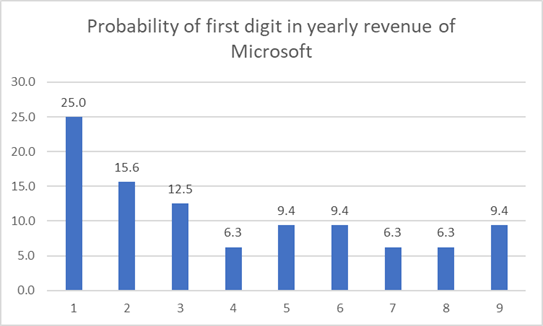

Don’t freak out as the data does not fully stick to the Benford’s Law, rather notice that for the same time window if my number of datapoints are reduced, the dataset tends to deviate from Benford’ Law theoretically. Please also note that 1 is still appearing as the leading digit very frequently, so good news for MICROSOFT stock holders!!!
In same way, if you see the data points for global average temperatures (in Kelvin) country-wise it will not fit the Benford’s Law; because there is no drastic variation in average temperatures in any given region.
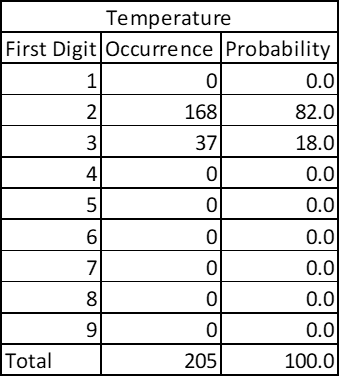
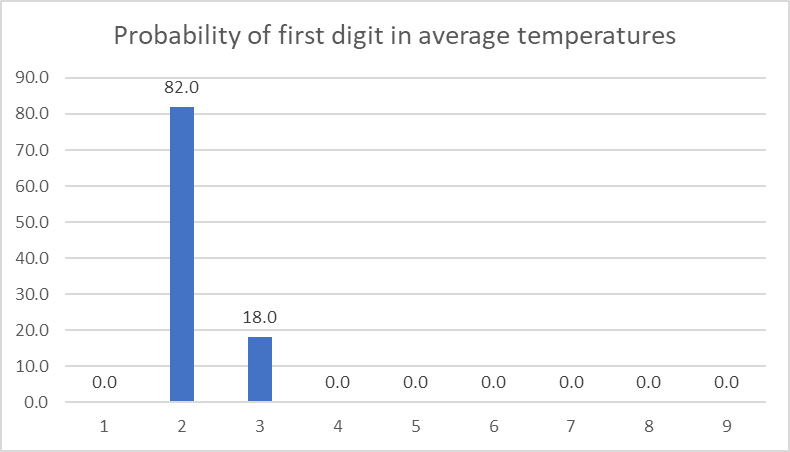
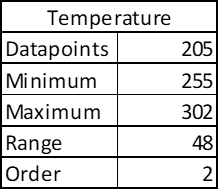
See there are 205 datapoints – big enough, but the temperatures are bound to a narrow range. Order of magnitude is small. Notice that it doesn’t matter if I express temperature in degree Celsius of in Kelvins as Benford’s Law is independent of scale.

Nature Builds Through Compounded Growth, Not Through Linear Growth!
Once you get the hold of Benford’s law, you will appreciate how nature decides its ways of working and creating. The Logarithmic law given by Frank Benford is a special case of compounded growth (formula of compound interest). Even though we are taught growth of numbers in a periodic and linear ways we are masked from the logarithmic nature of the reality. Frank Benford in the conclusion of his 1937 paper mentions that our perception of light, sound is always in logarithmic scale. (any sound engineer or any lighting engineer know this by default) The growth of human population, growth of bacteria, spread of Covid follow this exponential growth. The Fibonacci sequence is an exponential growth series which is observed to be at the heart of nature’s creation. That is why any artificial data set won’t fully stick to logarithmic growth behavior. (You can use this against machine warfare in future!) This also strengthens the belief that nature thinks in mathematics. Despite seemingly random chaos, it holds certain predictive pattern in its heart. Benford’s Law thus is an epitome of nature’s artistic ability to hold harmony in chaos!
You can download this excel file to understand how Benford’s law can be validated in simple excel sheet:
References and further reading:
- Cover image – Wassily Kandinsky’s Yellow Point 1924
- The Law of Anomalous Numbers, Frank Benford, (1938), Proceedings of the American Philosophical Society
- On the Distribution of First Significant Digits, RS Pinkham (1961), The Annals of Mathematical Statistics
- What Is Benford’s Law? Why This Unexpected Pattern of Numbers Is Everywhere, Jack Murtagh, Scientific American
- Using Excel and Benford’s Law to detect fraud, J. Carlton Collins, CPA, Journal of Accountancy
- Benford’s Law, Adrian Jamain, DJ Hand, Maryse Bйeguin, (2001), Imperial College London
- data source – Microsoft revenue – stockanalysis.com
- data source – Population – worldometers.info
- data source – Covid cases – tradingeconomics.com
- data source – GDP- worldometers.info
- data source – CO2 emissions – worldometers.info
- data source – unemployment – tradingeconomics.com
- data source – temperature – tradingeconomics.com
- data source – precipitation – tradingeconomics.com
